

A Countries' Economic Power Does Not Predict Its' Conservation Performance
By Marianne de Nazareth
02 December, 2014
Countercurrents.org
For those of us who have been writing about species loss for years, this new study conducted by conservation scientists from the Centre d'Ecologie Fonctionnelle et Evolutive (CEFE), the International Union for Conservation of Nature (IUCN), and BirdLife International comes as no shocking revelation that a countries economic power does not reflect its conservation of species. However, the study interestingly provides the first assessment of the performance of individual nations and regions in meeting their responsibilities for global biodiversity. Named ' Spatially Explicit Trends in the Global Conservation Status of Vertebrates' published in PLOS ONE on 26 November 2014, the paper is written by Ana S. L. Rodrigues, Thomas M. Brooks, Stuart H. M. Butchart, Janice Chanson, Neil Cox, Michael Hoffmann, Simon N. Stuart.
This study reveals with statistics to support their claim, that countries with the highest economic capacity are not performing better than others. Contrary to expectation, a country's per capita Gross Domestic Product( GDP) does not explain effectiveness at reducing biodiversity loss. Instead, success appears to result from sound policy implementation. Some countries are doing better than others at conserving their share of global vertebrate biodiversity, and the factors of success are not related to the fact that they are more developed or richer than others.
We were surprised to find that two of the world's wealthiest nations the United States and Australia are among the worst performers, said lead author Ana Rodrigues, Researcher at CEFE. This was even more striking given that developing countries such as Brazil, India, Peru and Madagascar have done proportionately much better at holding their commitments towards avoiding global biodiversity loss.
The world's governments have committed to preventing the extinction of threatened species and improving their conservation status by 2020 says the paper. However, biodiversity is not evenly distributed across space, and neither are the drivers of its decline, and so different regions face very different challenges. Here, we quantify the contribution of regions and countries towards recent global trends in vertebrate conservation status (as measured by the Red List Index), to guide action towards the 2020 target. We found that 50% of the global deterioration in the conservation status of birds, mammals and amphibians is concentrated in ,1% of the surface area, 39/1098 ecoregions (4%) and eight/195 countries (4%) Australia, China, Colombia, Ecuador, Indonesia, Malaysia, Mexico, and the United States. These countries hold a third of global diversity in these vertebrate groups, partially explaining why they concentrate most of the losses.
Yet, other megadiverse countries most notably Brazil (responsible for 10% of species but just 1% of deterioration), plus India and Madagascar performed better in conserving their share of global vertebrate diversity. Very few countries, mostly island nations (e.g. Cook Islands, Fiji, Mauritius, Seychelles, and Tonga), have achieved net improvements. Per capita wealth does not explain these patterns, with two of the richest countries United States and Australia fairing conspicuously poorly.
Different countries were affected by different combinations of threats. Reducing global rates of biodiversity loss will require investment in the regions and countries with the highest responsibility for the world's biodiversity, focusing on conserving those species and areas most in peril and on reducing the drivers with the highest impacts.
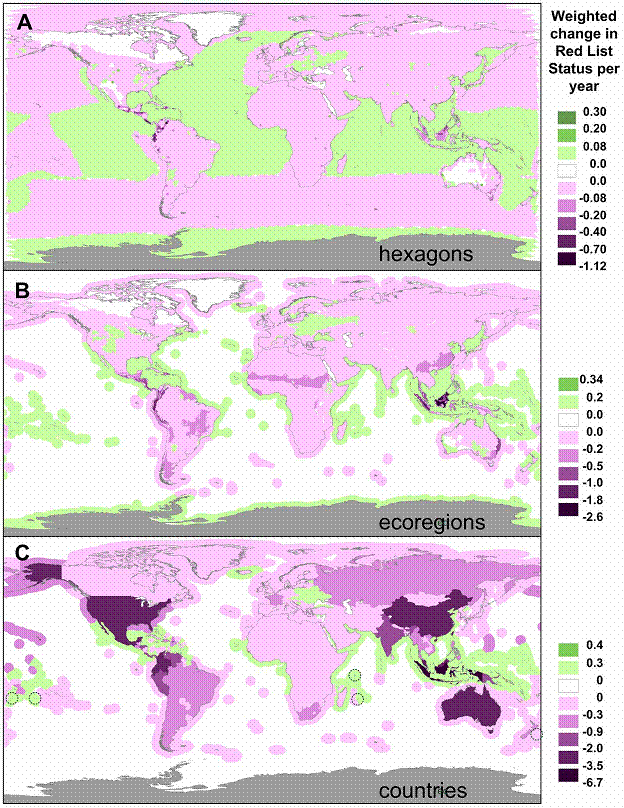
Figure 1. Spatially explicit trends in the global conservation status of vertebrates. Mapped as the variation across space in the weighted change in Red List status per year, across three types of spatial units: hexagons (equal-area, , 23,322 km 2 ), ecoregions (large biogeographic units). and countries (grouped according to sovereignty; e.g. New Caledonia within France). Magenta corresponds to spatial units that have made a net negative contribution to the global vertebrate conservation status as measured through the Red List Index, green to units that made a net positive contribution; grey regions (Antarctica) have no species. In (C), the island nations of Tonga, Cook Islands, Seychelles, Mauritius and Fiji (all with positive weighted change in the Red
List status per year) are indicated by a dashed circle.
(Source: doi:10.1371/journal.pone.0113934.g001)
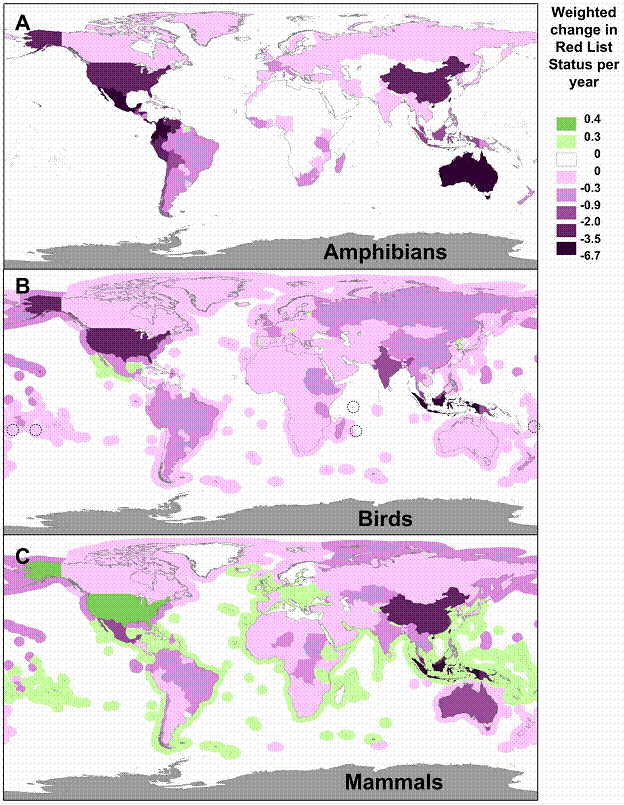
Figure 2 :
Country contributions towards trends in the global conservation status of amphibians, birds and mammals. Mapped as the variation across countries in the weighted change in Red List status per year, for different taxonomic groups. The same color scale is used across panels, so shades are directly comparable. In (B), the island nations of Tonga, Cook Islands, Seychelles, Mauritius and Fiji are indicated by a dashed circle. (Source: doi:10.1371/journal.pone.0113934.g001)
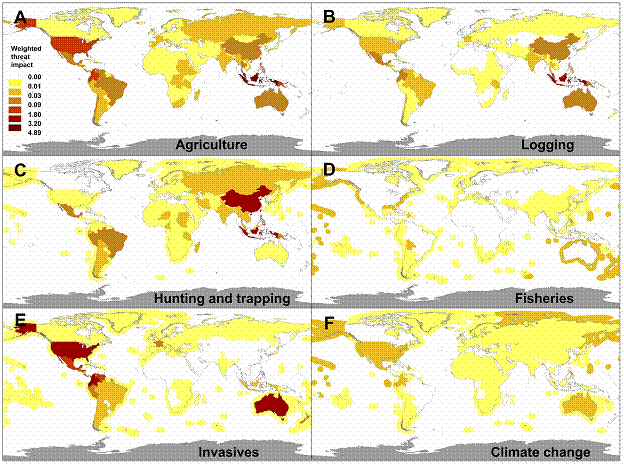
Figure 3. Contribution per country of different threats to the trends in the global conservation status of vertebrates. Mapped as the weighted impact of each threat type to the deterioration in global species conservation status, across countries. The same color scale is used across panels, hence shades are directly comparable. (Source: doi:10.1371/journal.pone.0113934.g001)
The paper says that increasing awareness about the accelerating rates of species extinctions had prompted the 193 governments Parties to the Convention on Biological Diversity (CBD) to commit in 2002 to achieve by 2010 a significant reduction of the current rate of biodiversity loss''. This target was missed, as the mounting pressure from threats to biodiversity surpassed the conservation efforts to reduce them. As a response, governments have recently agreed to an ambitious strategic plan for biodiversity, aiming at inspiring broad-based action by all countries and stakeholders in support of biodiversity between 2010 and 2020.
This plan includes a new target 12 stating that by 2020 the extinction of known threatened species has been prevented and their conservation status, particularly of those most in decline, has been improved and sustained''.
Global biodiversity targets are important in raising awareness among the public and policy makers, auditing management actions, and informing policy choices, but only if progress towards them can be rigorously quantified. The International Union for Conservation of Nature (IUCN) Red List Index is one of the indicators developed within the context of the 2010 target, and is now key for monitoring advances towards target 12 of the new strategic plan.
These country-level indices are useful for monitoring national biodiversity targets, but they are of limited value to informing progress towards global biodiversity targets. Indeed, they do not take into account the fact that different countries have different levels of global responsibility towards the conservation of the species they harbour. For example, the return of the Osprey Pandion haliaetus to Denmark as a breeding species contributed to this country's improving national red list index , but was inconsequential to the global Index, because Denmark holds a tiny fraction of this widespread species' population. In contrast, an improvement in the conservation status of Albert's Lyrebird Menura alberti in Australia (from Vulnerable to Near Threatened) is of global significance, because this species cannot be found anywhere else. Counter-intuitively, a country can have an improving national index while making a negative contribution to the global Red List Index, if improvements concern mainly species that are marginally represented within the country and deteriorations species for which the country is highly responsible.
Almost all regions and countries were found to have contributed negatively to global biodiversity trends for birds, mammals and amphibians, as measured by the IUCN Red List Index, but these losses were mainly concentrated in certain areas. Indeed, eight countries Australia, China, Colombia, Ecuador, Indonesia, Malaysia, Mexico and the United States are responsible for more than half of the global deterioration in the conservation status of vertebrate species.
Nonetheless, a handful of countries stand out for having tipped the overall balance from species sliding towards extinction to a net improvement in the status of the species for which they are responsible by setting some of them on the road to recovery. The best performers were five small island developing states, which have achieved net improvements in vertebrate conservation status.
That nations such as the Cook Islands, Fiji, Mauritius, Seychelles and Tonga have been able to reverse the extinction crisis in their countries demonstrates how effective conservation actions like invasive species eradication, biosecurity, management of protected areas, and ecosystem restoration can be, explained co-author Simon Stuart, Chair of the IUCN Species Survival Commission (SSC). A key to the success that these five countries have had is the implementation of consistent conservation actions over several decades. Conservation rarely achieves success through short-term projects, but requires a long-term approach, something that donors should take note of.
The study also reveals that the major threats to biodiversity differed substantially between areas. The impacts of overexploitation for food, traditional medicine and the pet trade have been most marked in Asian countries, particularly in China and Indonesia. Unsustainable agriculture and logging are the main drivers of biodiversity loss in Southeast Asia, while invasive species are a major threat in the United States, particularly Hawaii, and in Australia. In the tropical Andes and Central America, the invasive chytrid fungus is a leading cause of amphibian declines.
After the world's nations failed to meet the 2010 Biodiversity Target, to achieve by 2010 a significant reduction of the current rate of biodiversity loss', governments agreed on a new ambitious strategic plan for biodiversity. Aichi Biodiversity Target 12 adopted at the 10th Conference of the Parties to the Convention on Biological Diversity (CBD) in Nagoya, Japan, states that by 2020 the extinction of known threatened species has been prevented and their conservation status, particularly of those most in decline, has been improved and sustained'.
Meeting Target 12 will require focused, long-term conservation investment in countries with large shares of responsibility for global biodiversity, said co-author Stuart Butchart, Head of Science at BirdLife International. Each country needs to invest more in conserving the species for which it is solely or largely accountable, focusing on the most important sites for biodiversity, such as Important Bird and Biodiversity Areas, and other Key Biodiversity Areas.
Marianne de Nazareth- Freelance Science and Environment Journalist and registered PhD scholar with the Madurai Kamaraj University
.
Comments are moderated