
South Asia Among World's Most Climate Vulnerable Regions, Shows New Map
By Countercurrents.org
25 September 2013
Countercurrents.org
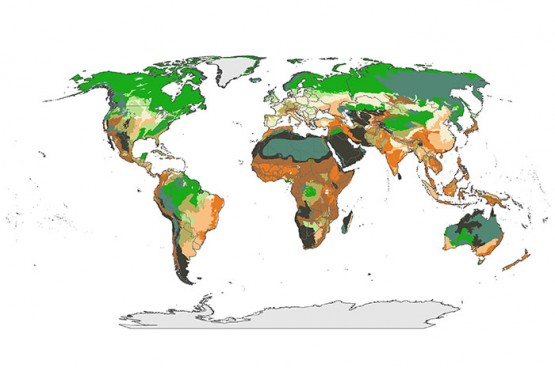
Dark grey marks regions that are climatically stable and have their vegetation intact. Dark orange marks regions that are climatically stable but don't have vegetation. Dark green marks regions that are not climatically stable and have high levels of intact vegetation. Pale cream marks regions with low climate stability and low levels of vegetation. Credit: Wildlife Conservation Society, Nature Climate Change
Southern and southeastern Asia, western and central Europe, eastern South Africa and southern Australia will face the greatest threats from climate crisis, finds a new study. The least vulnerable areas include north and southwestern Africa, northern Australia , and southern South America .
Ari Phillips reports * :
Climate change is much more than an environmental problem: It has large social, economic, health, safety and food impacts as well. But the pervasive reach of climate change does not detract from the often harmful effects it has on biodiversity and ecosystems.
Citing a recent study Ari adds:
The ecosystems are already more stressed than at any comparable period of human history a stress caused by shifting geographical ranges, changing ecosystem functions, population declines, and localized extinctions.
A new paper from scientists from the Wildlife Conservation Society attempted to map out the world's most vulnerable and least vulnerable areas in the face of climate change.
The researchers argue that most climate change assessments to date are incomplete as they fail to consider the way that landscapes have already been modified by human activities.
The researchers used two metrics: how intact an ecosystem is, and how stable the ecosystem is going to be under predictions of future climate change.
They defined climate stability as a measure of how much of an ecoregion will remain suitable for the species and ecosystems it currently contains.
The scientists found that precipitation was a strong determinant in climate stability.
Vegetation intactness was determined by measuring the amount of native vegetation that has been transformed through agricultural development and urbanization.
The study suggests that highly intact ecoregions with relatively stable climates are unlikely to require radical conservation interventions before the middle of the century. The establishment of protected areas may be the most sensible approach in these scenarios.
Conversely, ecosystems that are highly degraded may require very aggressive and proactive management strategies, such as species relocation, habitat engineering and large-scale restoration.
We need to realize that climate change is going to impact ecosystems both directly and indirectly in a variety of ways and we can't keep on assuming that all adaptation actions are suitable everywhere, lead author James Watson, director of WCS's Climate Change Program, said in a press release.
The analysis and map in this study is a means of bringing clarity to complicated decisions on where limited resources will do the most good.
According to the map, the U.S. contains all four identifiable regions. The U.S. EPA keeps track of climate impacts on ecosystems, a few of which include:
Warmer springs leading to earlier nesting for 28 migratory bird species on the East Coast.
Northeastern birds that winter in the southern United States returning north in the spring 13 days earlier than they did in the early 20th century.
16 out of 23 butterfly species in California shifting their migration timing and arriving earlier.
According to the EPA, Changes like these can lead to mismatches in the timing of migration, breeding, and food availability. Growth and survival are reduced when migrants arrive at a location before or after food sources are present.
The EPA also states that due to temperature increases, habitat ranges of many North American species are moving northward in latitude and upward in elevation. This can lead to range reduction and increased competition, or it can even leave species stranded with nowhere to go once they reach the limit of their habitat.
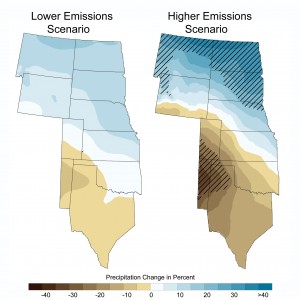
Projected percentage spring precipitation change in Great Plains region by the 2080s to 2090s. Credit: USGCRP (2009)
Much of the Great Plains is colored pale cream on the map, meaning both low relative climate stability and low levels of vegetation intactness.
According to the EPA, this region in the north-central part of the U.S. is an area of concern for thresholds, where ecosystem change can occur rapidly and irreversibly when a tipping point is passed. Many of the small, shallow lakes in the area, which are breeding habitats for most North American waterfowl species, are in danger due to the prospect of a permanently warmer, drier future. Already over the last 30 years, northern portions of the region have seen average winter temperatures rise to 7°F above historical averages.
* ClimateProgress, ThinkProgress, Sept. 24, 2013, This New Map Shows The World's Most Climate Vulnerable Regions,
http://thinkprogress.org/climate/2013/09/24/2669881/map-most-vulnerable-climate/
Comments are moderated