
Production Without Consumption: Gujarat Model Of Development
By Sanjeev Kumar
01 May, 2014
Countercurrents.org
Though there are other states in India where average production is better than Gujarat, but even if we decide to believe that in terms of total production, and income Gujarat is one among the best performing state in India, Gujarat performance in terms of average consumption level is worst in relation to its production level. And thus in this ways Gujarat here is far away from normalcy of the theory given by advocates of capital intensive system of production. In terms of per capita consumption expenditure, Gujarat’s performance in the decade 1993 to 2004-05 compared better than the last five years.1
NSSO report states that the urban MPCE was 49 per cent higher in towns and cities than in villages in 1993-94. Fourteen years later, the urban MPCE was 68 per cent higher than rural areas. This means, rural-urban disparity in terms of living standard of the people of Gujarat has been increasing consistently. At the same time this disparity has been reducing in states like Haryana, Tamil Nadu, Maharashtra etc. Increasing inequality in income distribution is considered as the prime reason for the intensifying disparity of consumption level. The condition of Gujarat in terms of distribution of income is even worst. In 2004-05 there were 21.65% landless people coming from lowest consumption group in Gujarat which increased to 40.90% in 2009-10. While the landlessness among two highest consumption group decreased by around 14%.2 If we look at the distribution of income, level of inequality in Gujarat is 33% while national average is 36%. This difference between Gujarat and India was wider in 1990s and thus Gujarat was better placed.3
Gujarat proudly claims that she is one of the largest producers of milk in India but when it comes to consumption of milk, the story is different. The total production of milk in Gujarat during last decade doubled but per capita consumption of milk (liter) is 6.178 and 6.750 in rural and Urban Gujarat. In comparison to this people of Delhi, Harayana, Himachal Pradesh, Jammu and Kashmir, Punjab, Rajasthan, Uttrakhand, Chandigarh is consuming more than any Gujarati.4
The growth in consumption of electricity in Gujarat was 143.97% during 1990s while during the one decade rule of Modi the growth was only 59.97%. Gujarat is claiming that they are giving 24 hour electricity to villagers but if we take per capita expenditure on electricity in Gujarat its 15.547 Kwh per month. Per capita consumption of electricity by People from almost nine states or union territories is much ahead than Gujarat while five states are marginally behind of Gujarat.5 But how we can expect people of a state like Gujarat to consume enough amount of electricity where electricity duty is in India. The tariff rate on electricity is 20% on rural areas if the consumption is less than 40 unit per month and if the consumption is more, tariff will be 25% to 30%.6
During 1990s the increase in consumption of electricity was highest in domestic sector, agriculture and in field of public water works while during 2000s the increase was highest in commercial and industrial sector while the consumption was decreased by around 16% in agriculture.7 The total subsidy for Agriculture on electricity in Gujarat increased merely from 3049 crores in 2007-08 to 3451 in 2010-11 while subsidy for domestic consumption was reduced from 451 crores 356 crores during the same period. In case of Haryana subsidy for agriculture and domestic consumer increased from 3122 and 416 crores to 4224 and 1174 crores during the same period. In case of TN figure jumped from 4422 and 3125 crores to 5924 and 5477 crores during the same time period.8
In terms of per capita spending on consumption of Books and journals by common people, Gujarat ranks 24th. In terms of per capita Spending on Stationery, Gujarat’s rank is 22nd; in terms of per capita spending on tuition and other fees Gujarat ranks 21st.9 The latest Household Consumer Expenditure Survey conducted by NSSO shows that a Gujarati residing in rural area spends just Rs 14 on education per month which is the lowest amount being spent among all the states, except the Naxal-affected tribal state of Chhattisgarh (Rs 11). (Indian Express 17 July 2013)
This condition of Education in Gujarat is direct result of deliberate negligence of education by the state. In 2010-11, Gujarat Government spent 15.9 per cent of its budget in education, when Bihar, Chhattisgarh, Haryana, Kerala, MH, Orissa, Rajasthan, Uttar Pradesh and West Bengal spent between 16 and 20.8 per cent. The national average was 16.6 per cent. (Indian Express 5 Sept 2013) Indian government is spending 1037 per head in rural government schools while Gujarat government spending only 984. Similarly Indian government is spending 3473 per head in urban government schools while Gujarat Government is spending only 2815 rupee. Similar is the case with Local Body schools and private aided schools.10 CAG reported that Central govt allocated Rs 292 crore for computer literacy and education but only Rs 88.24 crore was utilised.11 Gujarat’s population is 4.99% of india’s total population but when it comes to number of educational buildings Gujarat have only 4.42% of total educational buildings in india. But when we compare number of buildings of shop and offices Gujarat has 7.06% of total these kind of buildings in india; 9.47% of total factories, workshop; 6.04% place of worship.12 Gujarat has only 2.16% of all primary schools in India (2009-10); while there is no distance education institution in the state.13 Primary school teachers in villages were paid only Rs 2500 monthly as their salary till 2010 when finally High Court of Gujarat forced the State Government for 20% increase in their salaries. (Times of India, 26 Oct 2010) After Supreme Court of India slams State Government, the salary was further increased to Rs 5300. (Times of India, 24 May 2013; Ibnlive, 21 May 2013)
Gujarat government might give a hypothesis for explaining the reason for bad consumption level in the state, by saying that the people of her state is investment friendly and thus they prefer to save their increased income for further investment. But this hypothesis also cannot work in case of Gujarat because per capita deposit ratio in the state is not good. In terms of credit-deposit ratio, Gujarat is far behind others. In 2010 it was 4.70% in Gujarat while the same for MH, Karnataka and Tami Nadu was 29.75%, 6.71% and 9.61% respectively. The amount of per capita deposit and per capita credit for Gujarat was Rs 37,174 and Rs 24,268; while for TN, it was Rs 42,580 and Rs 47,964; for Karnataka it was Rs 49,598 and Rs 38,154; and for MH it was Rs 1,10,183 and Rs 89,575. Even Kerala did better than Gujarat with Rs 43,890 and Rs 27,912. (11 June 2012, TOI)
Better production and better income is always taken as precondition for the better health, better education, and improved condition of other aspect of life and thus better position in HDI. It is also assumed that higher income of state will follow higher state expenditure on different social welfare schemes, but picture of Gujarat is different. In terms of share of developmental expenditure to total expenditure till 1999-00 Gujarat was much ahead of the most of the developed states and national average but by 2007-08 MH and TN went ahead of Gujarat and the gap between Gujarat and other states became very narrow. This deteriorating condition of life of Gujarat people is applicable to other aspects of life also and all these are because of state negligence to important aspect of governance such as introduction of enough government schemes for weaker section of society and efficient implementation of declared schemes. The state of conservatism in the very heart of the policies of Government reflect in state’s priority towards the investment in people’s awareness campaign and other ways of eliminating those social and economic evils from the society. According to RBI, Gujarat was ranked 17 among the 18 largest states in India in terms of spending on social sector which was just 31.6% of the budgetary expenditure State.14 There is hardly any emphasis on awareness campaign for reduction of population. The population growth rate during 2001-2011 for Gujarat is 19.17% while for India its 17.64%.15
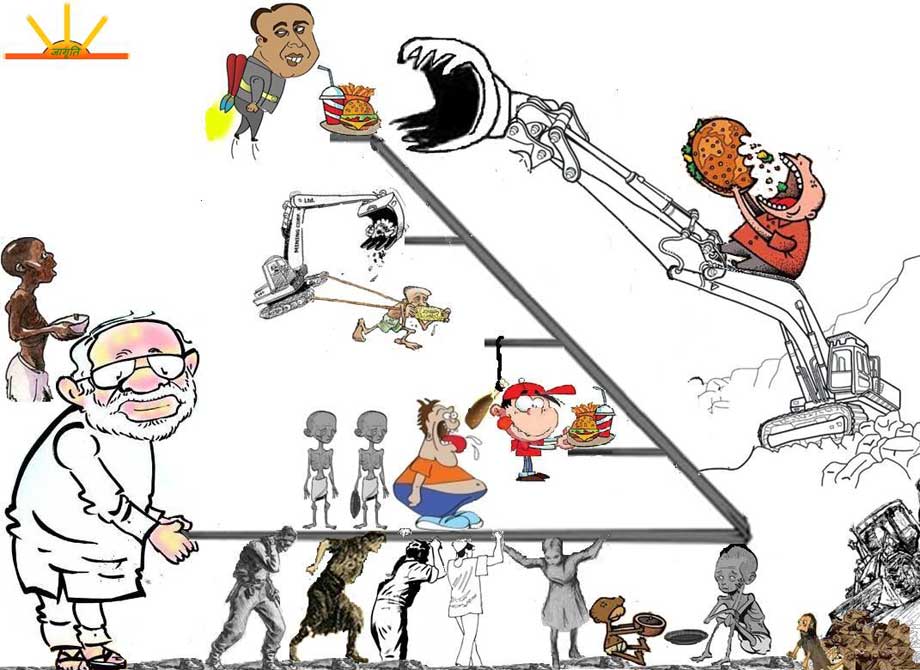
Government is favouring capital intensive system of production and large scale production system because the production capacity and rate of production under this system has always believed to be ahead of production under labour intensive and small scale system of production. The advocate of capital intensive system of production believe that rapid increase in rate of production will always led to cheaper availability of products and thus better per capita consumption which is indicate better level of life. But the advocate of capital intensive system of production, forget that their hypothesis can work only if system also ensure fare distribution of those increased production and profits to the downtrodden population of the society. In reality, most of the increased production and profits became concentrated in the hand of capitalist and to some extant in the hand of tiny middle class of the society while the situation of downtrodden part of society further deteriorated. Capital intensive production system gives least priority to generation of employment. The people’s participation rate in rural Gujarat increased till 2004-05 but after that it declined rapidly which means that real inhabitant of rural Gujarat are being forced to detached herself from the rural economy. Whatever increase we saw, it has been in agriculture sector which mean dependence on agricultural economy for employment has consistently increased in last decade.16 Under decreasing employment opportunities and wages, consumption level of the poor of the state was inevitable.
This article is part of my report on Gujarat’s model of development. I prepared this report for Jagriti Natya Manch (Theater Group) which consist students from JNU, DU, IIMC. I am one of the founding member of this group. This report is edited(corrected) by Atul Sood(CSRD/JNU). Email: [email protected]
Notes:
1) Atul Sood, Poverty amidst prosperity: Essays on the Trajectory of Development in Gujarat, 2012, Aakar Publication, p 249, Table: 7.1
2) Sood, 2012, p236, Table 5.12 & NSSO 66th round, 2009-10
3) Sood, 2012, p 250, Table 7.1 & 7.3
4) NSSO Report No.541: 2009-10; Household Consumption of Various Goods and Services in India; p. 38
5) NSSO report 2009-10, p 41
6) Government of Gujarat, Legislative and Parliamentary Affairs Department, schedule 1, section 3 (1) (a), http://guj-epd.gov.in/Electricity%20Duty%20Act%201958.pdf page number 12
7) Socio-Economic Review, Gujarat State 2012-13, pp S-56-60
8) Sood, 2012, & Annual Report of the Working of State Power Utilities and Electricity Department, Planning Commission, Oct 2011
9) NSSO report 2009-10; published in 2012, p 42
10) Atul Sood, 2012, p 274, table 9.20
11) Economic Times, “8 holes CAG picked in Narendra Modi’s Gujarat development plan”
12) Socio-Economic Review, Gujarat State 2012-13, p 89; Socio-Economic Review, Gujarat State 2005-06, pp S-92-93
13) Socio-Economic Review, Gujarat State 2012-13, p 95
14) Indira Hirway, ‘Partial View of Outcome of Reforms and Gujarat Model’, EPW, October 26, 2013, vol xlviii no 43
15)Socio-Economic Review, Gujarat State 2012-13, p. N VII
16) Sood, 2012, p. 256, table 8.2 (NSSO 50th and 66th round)
Comments are moderated