The U.S. Is Now #2 Worldwide In Wind Power With 66 GW
By Michael Graham Richard
12 August, 2015
Treehugger.com
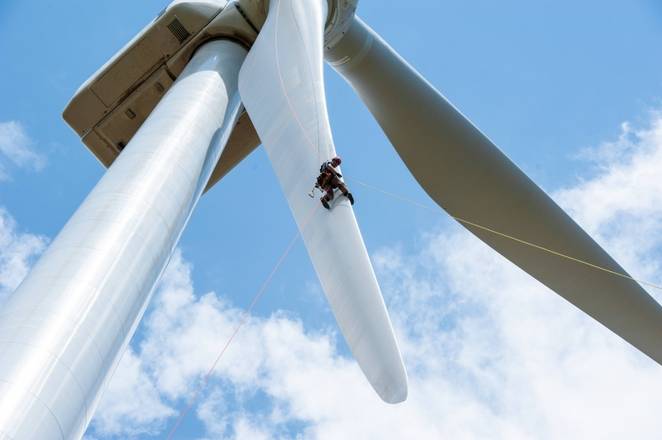
Lately, most of the attention in the clean energy sector has been directed at solar, and for good reason. We're literally in the middle of an energy revolution, and I believe that solar will take over the world over the coming decades. But wind power keep chugging along, with prices falling over time - though not as dramatically as solar - and installed capacity going up. Every new turbine that goes up will keep producing clean power for decades to come at very little cost (basic maintenance, no fuel costs unlike fossil fuel power plants). In a manner of speaking, we are planting the seeds of tomorrow's greener future.
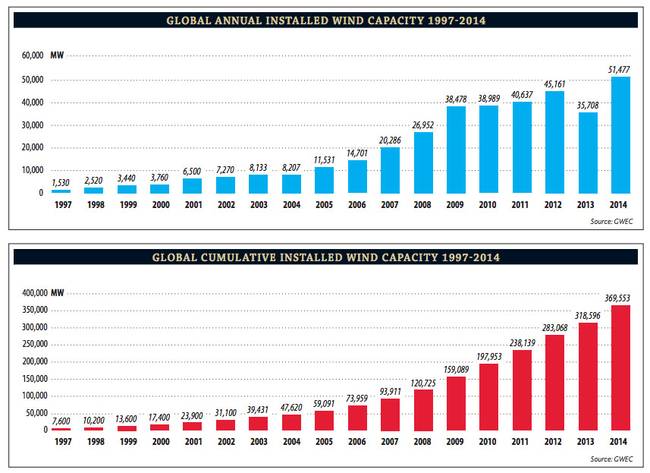
GWEC/Screen capture
Above you can see world wind power stats since 1997. While the annual installed capacity has been bouncing around a bit, the cumulative numbers (in red) show a pretty smooth ride upward. In 1997, 1.5 GW of new capacity was considered a lot, while last year we saw over 51 GW being added!
So the global numbers are nice, but how has wind power been doing lately in the U.S.? Glad you asked! The U.S. Department of Energy (DOE) has just released a report about this very thing.
DOE wind power report 2014/ DOE/Public Domain
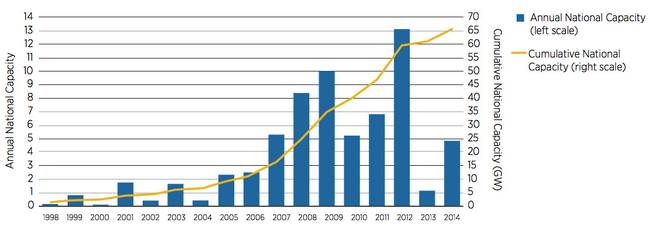
The graph above shows similar data to the previous two graphs for global wind power, but combined into one. The blue bars show new additions each year, and the yellow line shows cumulative capacity. After a tough year in 2013, 2014 goes back up some to 4.8 GW of new wind power capacity.
Cumulative U.S. wind power capacity stood right under 66 GW at the end of 2014. This is enough to meet 4.9% of end-use electricity demand in an average year, so there's still a lot of work to be done.

DOE wind power report 2014/ DOE/Screen capture
This graph shows new electricity-generating capacity additions. You can see that in recent years both wind and solar are starting to be a much larger portion of the total. Last year, wind power represented 24% of U.S. electric-generating capacity additions, and since 2007, it has represented 33% of the total.
DOE wind power report 2014/ DOE/Public Domain
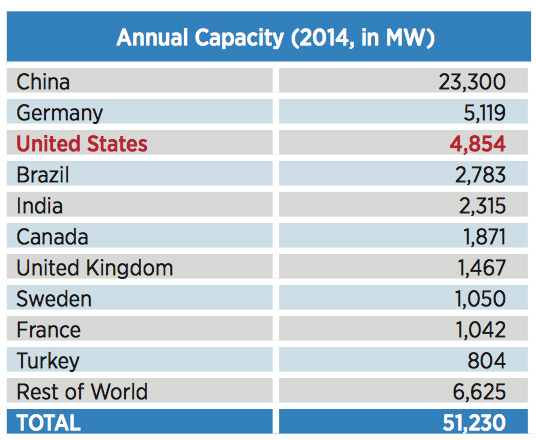
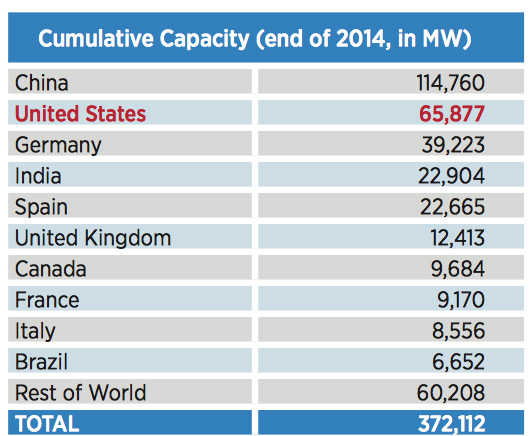
Here we break it down by countries. As you can see, China is the clear leader when it comes to wind power these days. Germany is doing well too - better than the U.S. despite being a smaller country - but in the next table below, you can see that the U.S. still ranks above Germany in total cumulative wind power capacity.
DOE wind power report 2014/ DOE/Public Domain
In my opinion it's a shame that the U.S. is so far behind China when it comes to wind power despite being a much richer country. The country should aim for clean energy leadership; it requires upfront investment, but infrastructure projects create jobs, and once they are built, we can benefit from them for decades with low-cost clean energy.
COPYRIGHT © 2015 MNN HOLDING COMPANY, LLC.
Comments are moderated


