

Warmer And Warmer
By Realclimate.org
14 September, 2010
Realclimate.org
Are the heat waves really getting more extreme? This question popped up after the summer of 2003 in Europe, and yet again after this hot Russian summer. The European Centre for Medium-range Weather Forecasts (ECMWF), which normally doesn’t make much noise about climate issues, has since made a statement about July global mean temperature being record warm:
Consistent with widespread media reports of extreme heat and adverse impacts in various places, the latest results from ERA-Interim indicate that the average temperature over land areas of the extratropical northern hemisphere reached a new high in July 2010. May and June 2010 were also unusually warm.
Here, the ERA-Interim, also referred to as ‘ERAINT’, is the ECMWF’s state-of-the-art reanalysis. But the ERAINT describes the atmospheric state only since 1989, and in isolation, it is not the ideal data set for making inferences about long-term climate change because it doesn’t go all that far back in time. However, the statement also draws on the longer reanalysis known as the ERA40 re-analysis, spanning the time interval 1957-2002. Thus, taken into context of ERA40, the ECMWF has some legitimacy behind their statement.
The ERAINT reanalysis is a product of all suitable measurements fed into a model of the atmosphere, describing all the known relevant physical laws and processes. Basically, reanalyses represent the most complete and accurate picture that we can give for the day-to-day atmosphere, incorporating all useful information we have (satellites, ground observations, ships, buoys, aircrafts, radiosondes, rawinsondes). They can also be used to reconstruct things at finer spatial and temporal scales than is possible using met station data, based on physical rules provided by weather models.
The reanalyses are closely tied to the measurements at most locations where observations – such as 2-meter temperature, T(2m), or surface pressure – are provided and used in the data assimilation. Data assimilation is a way of making the model follow the observations as closely as possible at the locations where they are provided, hence constraining the atmospheric model. The constraining of the atmospheric model affect the predictions where there are no observations because most of the weather elements – except for precipitation – do not change abruptly over short distance (mathematically, we say that they are described by ’spatially smooth and slowly changing functions’).
There are also locations – notably the in the Polar regions and over Africa – where ground-based measurements are sparse, and where much is left for the weather models to predict without observational constraints. In such regions, the description may be biased by model shortcomings, and different reanalysis may provide a different regional picture of the surface conditions. Surface variables such as T(2m) are strongly affected by their environment, which may be represented differently in different weather models (e.g. different spatial resolution implies different altitudes) and therefore is a reason for differences between reanalyses.
Furthermore, soil moisture may affect T(2m), linking temperature to precipitation. The energy flow (heat fluxes) between the ground/lakes/sea and the atmosphere may also affect surface temperatures. However, both precipitation and heat fluxes are computed by the reanalysis atmosphere model without direct constraints, and are therefore only loosely tied to the observations fed into the models. Furthermore, both heat fluxes and precipitation can vary substantially over short distances, and are often not smooth spatial functions.
While the evidence suggesting more extremely high temperatures are mounting over time, the number of resources offering data is also growing. Some of these involve satellite borne remote sensing instruments, but many data sets do not incorporate such data.
In the book “A Vast Machine“, Paul N. Edwards discusses various types of data and how all data involve some type of modelling, even barometers and thermometers. It also provides an account on the observational network, models, and the knowledge we have derived from these. Myles Allen has written a review of this book in Nature, and I have reviewed it for Physics World (subscription required for both).
All data need to be screened though a quality control, to eliminate misreadings, instrument failure, or other types of errors. A typical screening criterion is to check whether e.g. the temperature estimated by satellite remote sensing is unrealistically high, but sometimes such screening may also throw out valid data, such as was the case of the Antarctic ozone hole. Such post-processing is done differently in analyses, satellite measurements, and reanalyses.
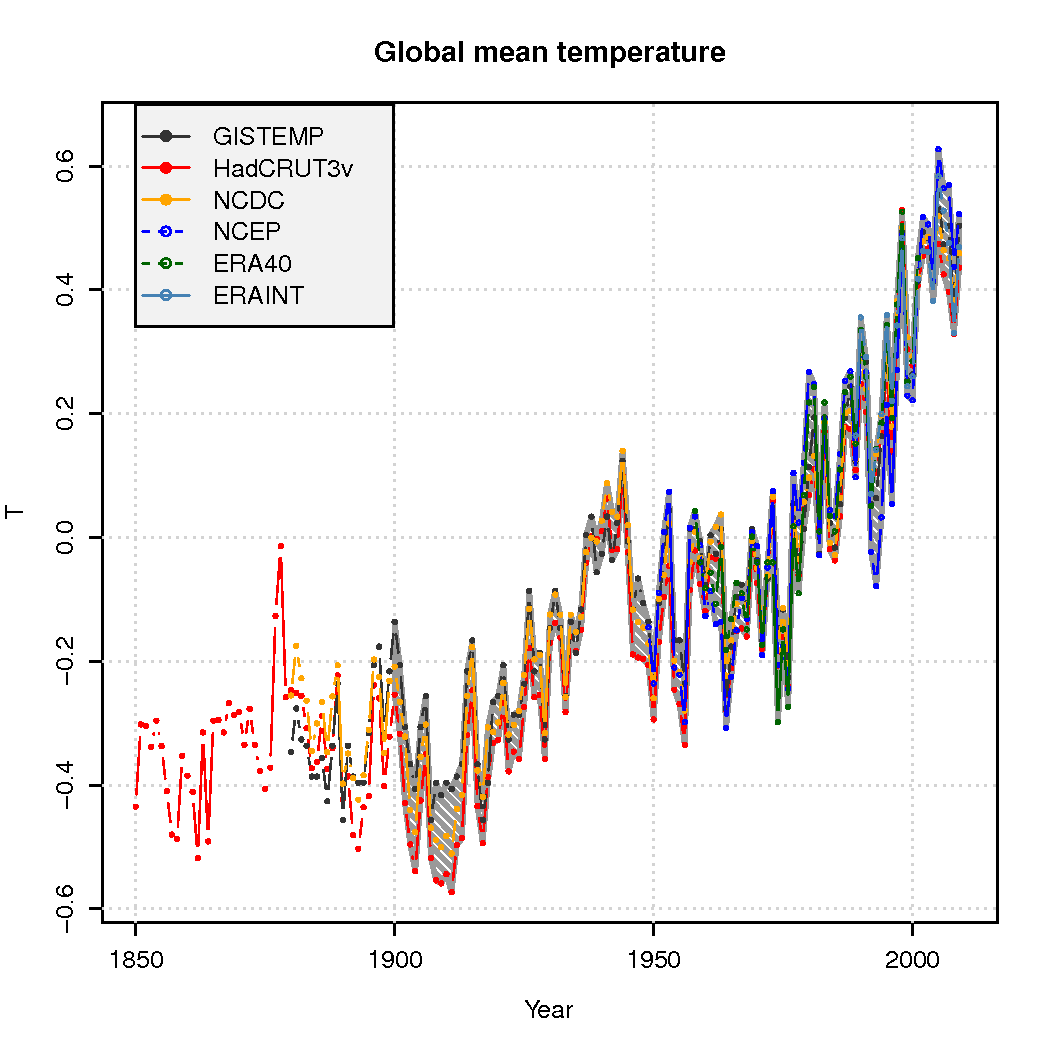
The global mean temperature estimated from the ERAINT, however, is not very different from other analyses or reanalyses (see figure below) for the time they overlap. We also see a good agreement between the ERA40 reanalysis, the NCEP/NCAR reanalysis, and the traditional datasets – analyses – of gridded temperature (GISTEMP, HadCRUT3v, NCDC).
 Do the ERAINT and ERA40 provide a sufficient basis for making meaningful inferences about extreme temperatures and unprecedented heat waves? An important point with reanalyses, is that the model used doesn’t change over the time spanned by the analysis, but reanalyses are generally used with caution for climate change studies because the number and type of observations being fed into the computer model changes over time. Changes in the number of observations and instruments is also an issue affecting the more traditional analyses.
Since the ERAINT only goes as far back as 1989, it involves many modern satellite-borne remote sensing measurements, and it is believed that there are less problems with observational network discontinuity after this date than in the earlier days. It may be more problematic studying trends in the ERA40 data, due to huge improvements in the observational platforms between 1958 and now. Hence, it is important also to look at individual long-term series of high quality. These series have to be ‘homogeneous’, meaning that they need to reflect the local climate variable consistently through its span, not being affected by changes in the local environment, instrumentation, and measurement practices.
An analysis I published in 2004, looking at how often record-high monthly temperatures recur, indicated that record-breaking monthly mean temperature have been more frequent that they would have been if the climate were not getting hotter. This analysis supports the ECMWF statement, and was based on a few high-quality temperature series scattered across our planet, chosen to be sufficiently far from each other to minimize mutual dependencies that can bias the analysis.
The ECMWF provides data for some climate indices, such as the global mean temperature, and the National Oceanic and Atmospheric Administration (NOAA) has a web site for extreme temperatures and precipitation around the world with an interactive map, showing the warmest and coldest sites on the continents. Another useful tool is the KNMI ClimateExplorer, where people can both access data and carry out different analyses on line. It is also possible to get climate data on your iPhone/iPod Touch throug Apps like Climate Mobile.