


Extremely Hot
By Stefan Rahmstorf & Dim Coumou
27 March, 2012
Realclimate.org
One claim frequently heard regarding extreme heat waves goes something like this: ”Since this heat wave broke the previous record by 5 °C, global warming can’t have much to do with it since that has been only 1 °C over the 20th century”. Here we explain why we find this logic doubly flawed.
One can ask two different questions about the influence of global warming on heat waves (Otto et al. 2012), and we take them in turn.
1. How much hotter did global warming make this heat wave?
We have some trouble with framing the question like this, because it tacitly assumes that the same weather situation would have also arisen without global warming, only at a (say) 1 °C lower temperature level. That need not be the case, of course, since weather is highly stochastic and global warming can also affect the circulation patterns of the atmosphere.
But even if we accept the basic premise (and it could be meant in a purely statistical sense, although that is not usually how it is expressed), would an average anthropogenic warming by 1 °C in the relevant location mean that 1 °C is also the amount added to an extreme event? Only in a linear climate system. Imagine a heat wave that pushes temperatures up to 30 °C in a world without global warming. In the same weather situation with global warming, you might expect that this weather then results in a 31 °C heat wave. But that could well be wrong. Possibly in the situation with warming, the soil has dried out over the previous months because of that extra 1 °C. So now you lost evaporative cooling, the incoming sunlight turns into sensible heat rather than a large fraction going into latent heat. That is a non-linear feedback, and not an imagined one. Detailed studies have shown that this may have played an important role during the European heat wave of 2003 (Schär et al. 2004).
The basic phenomenon is familiar to oceanographers: if the mean sea level in one location rises by 30 cm, this does not mean that the high-tide level also rises by 30 cm. In some cases it will be more, due to nonlinear feedback. I.e., a higher water level increases the flow cross-section (think of a tidal inlet) and reduces bottom friction so the tide rolls in faster, reaching a higher peak. The tidal range increases as well as the mean sea level.
Numerous other non-linear mechanisms are possible, which we are only beginning to understand – think of the recent studies that show how changes in snow cover or sea ice cover as a result of global warming affect weather systems. Or think of factors that could affect the stability of particularly strong blocking events. Thus, we’d be very cautious about making an essentially linear, deterministic argument about heat extremes to the public.
In the scientific literature, the influence of global warming on extreme events is therefore usually discussed in terms of probabilities, which is more fitted to stochastic events. The typical question asked is:
2. How much more likely did global warming make this heat wave?
For this question, it is easily shown that the logic “the greater the extreme, the less global warming has to do with it” is seriously flawed. The change in probability of certain temperature values being reached can be visualised with a probability density function (see Figure). The probability distribution could be shifted unchanged towards warmer values, or it could be widened, or a combination of both (or some other deformation).
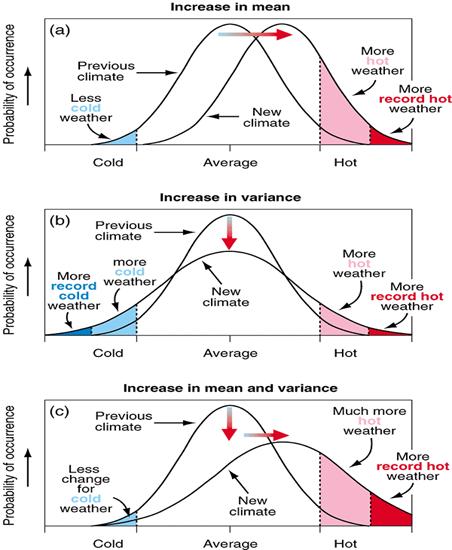
IPCC (2001) graph illustrating how a shift and/or widening of a probability distribution of temperatures affects the probability of extremes.
For illustration, let’s take the most simple case of a normal distribution that is shifted towards the warm end by a given amount – say one standard deviation. Then, a moderately extreme temperature that is 2 standard deviations above the mean becomes 4.5 times more likely (see graph below). But a seriously extreme temperature, that is 5 standard deviations above the mean, becomes 90 times more likely! Thus: the same amount of global warming boosts the probability of really extreme events, like the recent US heat wave, far more than it boosts more moderate events. This is exactly the opposite of the claim that “the greater the extreme, the less global warming has to do with it.” The same is also true if the probability distribution is not shifted but widened by a constant factor. This is easy to show analytically for our math-minded readers.
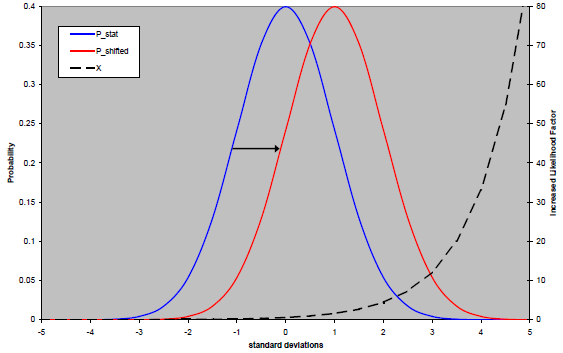
Graph illustrating how the ratio of the probability of extremes (warmed climate divided by unchanged climate – this increased likelihood factor is shown as a dashed line, scale on right) depends on the value of the extreme.
So in summary: even in the most simple, linear case of a shift in the normal distribution, the probability for “outlandish” heat records increases greatly due to global warming. But the more outlandish a record is, the more would we suspect that non-linear feedbacks are at play – which could increase their likelihood even more.
P.s.
Our Perspective article on the unprecedented extremes of the last decade was just published by Nature Climate Change: Coumou & Rahmstorf (2012) A decade of weather extremes (paywalled)
References:
Otto et al., Reconciling two approaches to attribution of the 2010 Russian heat wave, Geophysical Research Letters 2012, VOL. 39, L04702, doi:10.1029/2011GL050422
Schär, C. et al. The role of increasing temperature variability in European summer heat waves. Nature 427, 332–336 (2004).
 Stefan Rahmstorf: A physicist and oceanographer by training, Stefan Rahmstorf has moved from early work in general relativity theory to working on climate issues. He has done research at the New Zealand Oceanographic Institute, at the Institute of Marine Science in Kiel and since 1996 at the Potsdam Institute for Climate Impact Research in Germany (in Potsdam near Berlin). His work focuses on the role of ocean currents in climate change, past and present. In 1999 Rahmstorf was awarded the $ 1 million Centennial Fellowship Award of the US-based James S. McDonnell foundation. Since 2000 he teaches physics of the oceans as a professor at Potsdam University. Rahmstorf is a member of the Advisory Council on Global Change of the German government and of the Academia Europaea. He is a lead author of the paleoclimate chapter of the 4th assessment report of the IPCC.
 Dim Coumou: A geophysicist by training, Dim Coumou worked for a while as marine geophysicist in the offshore industry, before starting PhD research at ETH in Zurich. In Zurich, I worked on the development of efficient multiphase fluid flow transport schemes which I used to study hydrothermal systems. More on my PhD work can be found here and here. In 2008, I joined Potsdam Institute for Climate Impact Research (PIK) and currently I am working on development of the atmospheric component of the next-generation Earth System model CLIMBER-3 (as part of PIK´s flagship project NEXT). This novel atmosphere model, Aeolus 1.0, treats the dynamical equations in a statistical way, which makes the model computationally very efficient compared to the more common general circulation type models. We can therefore study the sensitivity of atmospheric circulation to global mean temperature and other key parameters. Next, this newly developed model (a so-called Earth System Model of Intermediate Complexity - EMIC) should pave the way to efficiently study tipping elements in the Earth climate system, of which some could potentially cross a tipping point in the coming century due to anthopogenic forcings. My recent work focused on the link between extreme weather events and global warming, which got some popular-media attention in e.g. WIRED and FOCUS (in german). My scientific interests include climate dynamics, extreme events, global warming, complex earth system, hydrothermal and geothermal systems. Technical interests include parallel programming, C++, object-oriented design, etc, etc, etc...
Due to a recent spate of abusive, racist and xenophobic comments we are forced to revise our comment policy and has put all comments on moderation que.