

Poverty Spectrum Disorder
By Sadanand Patwardhan
05 August, 2010
Countercurrents.org
Man doth not live by bread only is an oft quoted sentence from the Book of Deuteronomy to emphasise that man has spiritual needs beside physical. In India, estimation of number of poor is a sensitive political issue and drawing a poverty line an unending game on political chessboard. Estimating Poverty or the number of poor is not a vexing issue. Techniques of Sample Surveys & Statistical Methods of inference are highly sophisticated to accomplish the job to desired degree of accuracy. Nor is there dearth of trained manpower to carry out the task ably within the government organizations themselves. The real issue is with defining who is poor or what deprivations define poverty. The minimalist approach used in drawing hitherto accepted official poverty line relies on Sufficiency of Bread alone in sorting out poor from not-poor . Moreover, government likes to believe, would like to have us believe too, that wealth is in fact trickling downwards to lift more and more people out of poverty. The ruling maxim is if economy is so operated as to deliver double digits or near double digits GDP growth rates then everyone is automatically better of including the poor. There is a talk of inclusive growth from time to time, especially in election seasons, but its use is more as an unavoidable expedient than moral conviction.
Proving of this questionable maxim obviously lies in showing a declining trend over the years in number of poor. That is why how one defines a poor is a paradigm changer it makes or mars the maxim authorized by the government. Definitions by their very nature are arbitrary choices, though the choices themselves may be rationalized by their selectors. Population Reference Bureau has summarized the findings of some prominent efforts in recent years to estimate the number of poor based on definitions that differ a bit see the graphics below.
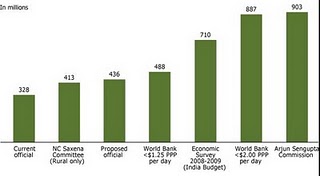
Source : PRB (Population Reference Bureau) : What is Poverty Really? The Case of India .
What strikes first are the widely fluctuating figures in the numbers of poor or the Numerous Poverties that encounter us. It is this variety that the mainstream media & pundits have largely quibbled over. Those who worship growth find the lowest of estimates large enough. While those who find the most accommodating definition of poor inadequate find the largest of estimates falling short. Such debates have irked many thinkers and activists as can be seen from this response, Who needs poverty estimates? By Devinder Sharma . But when one looks at the underlying assumptions of different estimates, a strikingly new picture emerges. I have tabulated the following table to highlight this picture.
Agency |
Rural Poor % |
Urban Poor % |
Poor nos. Mn. |
Basis |
Current Official |
29% |
26% |
328 |
Rural< 2400 kcal/day = Rs . 12/day . Urban< 2100 kcal/day = Rs.18/day |
Proposed Official (Tendulkar) |
42% |
26% |
436 |
Used 26% Urban BPL official figure as given & then calculated expenditures to meet the chosen basket of goods & services (health & education). Rural< Rs.15/day . Urban< Rs.19/day |
Rural Development Ministry |
50% or 80% if < 2400 kcal / day. |
Rural< 2100 kcal/day = Rs.23/day . Urban< 2100kcal/day = Rs.33/day |
||
Economic Survey (2008-09 Budget) |
72% |
32% |
710 |
< Rs. 20 / Day |
NCEUS (Arjun Sengupta) |
77% . |
903 |
86% work Force in Unorganized sector. < Rs. 20 / Day |
|
World Bank |
41.6% Urban & Rural combined. |
488 |
< $1.25 Purchasing Power Parity. |
|
World Bank |
75.6% Urban & Rural combined. |
887 |
< $2.00 / Day |
|
A couple of rupees of difference in consumption levels that are used in defining poor is all it takes to shift literally hundreds of millions of people from poor to non-poor and vice versa. Once this is learnt it becomes obvious that Poverty Line is unlike an internationally recognized BORDER that it is made out to be inviolable & sacrosanct - a sort of litmus test to decide whether to bestow or to withhold welfare largesse . In fact, what we have is apicture of Poverty Spectrum a continuum of deprivations that has wafer thin separations . The much vaunted Better Targeting of welfare measures touted by pundits, then turns out to be an abominable subterfuge at EXCLUSION rather than the much professed goal of INCLUSION . Providing universal access to Right to Food Act coverage & Public Distribution System ( PDS ) advocated by activists and some economists not only now makes sense but becomes the only way forward.
The table below gives the per capita income at 2004-05 constant prices for past 5 years.
Per Capita Income at 2004-5 Prices |
|||
Income |
Growth |
Income/ |
|
Rs. |
Rate |
Day Rs. |
|
2004-05 |
29,745 |
81.49 |
|
2005-06 |
32,012 |
7.62 |
87.70 |
2006-07 |
34,533 |
7.88 |
94.61 |
2007-08 |
37,328 |
8.09 |
102.27 |
2008-09 |
38,695 |
3.66 |
106.01 |
2009-10 |
40,745 |
5.30 |
111.63 |
Now for the sake of argument if we were to assume that 90% of India's total population lives on < Rs.20/day , even then the average income of balance 10% of the population works out to < Rs. 950/day or < Rs. 30,000/Month. This is the salary a very lucky engineering graduate working for one of the top notch BPO companies hopes to earn in his first job on joining or in about 2 years time. Yet, this is not about the dire economic differences between the vast 90% and the rest 10%, but about the not so obvious income inequalities even within these privileged 10%. If this is not an eye opener about stark disparity plaguing our country and the intensity of poverty affecting overwhelming majority of our populace, then nothing will.
Oxford Poverty & Human Development Initiative (OPHI) & the UNDP Human Development Report have created a new measure of poverty called Multi Dimensional Poverty Index ( MPI ) that further extends the definition beyond sufficiency of bread. It is a weighted measure along three dimensions of Education (Years of Schooling, School Enrollment), Health Outcomes (Nutrition, Child Mortality), & Standard of Living - better described by Access to Basic Amenities - (cooking fuel, toilet, water, electricity, floor, asset ownership) and has 10 variables in all. The MPI Ground Reality Check stories from different countries can be accessed here . Indian Media reported some of the sensational findings regarding both Intensity of Poverty ( poverty in at least eight Indian States Bihar, Uttar Pradesh, Rajasthan, West Bengal, Orissa, Madhya Pradesh, Chhattisgarh and Jharkhand was worse than in some of the poorest countries of sub-Saharan Africa ) & Magnitude ( more poor people in eight Indian States than in the 26 poorest African states combined in India there are nearly twice as many MPI poor than in Africa ) from the MPI report. It ruffled lot of feathers as these findings came in just as the brand new international airport at Delhi - built at the dizzying cost of Rs. 90,000 million - was inaugurated. Though there are a few honourable exceptions, mainstream media does publish such shocking contrasts for its TRP value once in a while, but once done it is business as usual of ignoring the poor & belittling poverty.
http://searchlight-is-on.blogspot.com/