

The Atmosphere Is Not Waiting For
Human Decision
By Andrew Glikson
30 November, 2009
Countercurrents.org
The cumulative nature and centuries to millennia-scale atmospheric residence time of CO2 is tracking toward the natural boundary between the current interglacial climate state and a transient greenhouse climate state, defined by paleoclimate history above a level equivalent to 500 ppm CO2 [1]. The effects of this rise are evidenced by contemporaneous melting of Mountain glaciers, Arctic Sea ice, Greenland and West and East Antarctica ice sheets (Fig. 1) and the increasing rate of sea level rise.
Global warming by +0.8 degrees C since 1750, plus +0.5 degrees C currently masked by sulphur aerosols, with further effects of ice albedo (reflection) loss not yet accounted for, has surpassed the temperature rise associated with the last interglacial (Emian: 124,000 years ago; ~ +1 degree C; ~ +4 to 6 meter sea level rise) (Figs 2 – 4). At 460 ppm CO2-e (a value including the CO2-equivalent radiative forcing of methane) the energy level of the atmosphere exceeds that of the mid-Pliocene (2.8 million years ago; CO2 ~400 ppm, +2 to +3 degrees C; sea levels +25±12 meters). As CO2 and temperatures rise they track toward levels reached in the mid-Miocene ~13-15 million years ago (CO2 levels near-500 ppm; deep sea temperature 4.0 - 4.4 degrees C) and the Oligocene (CO2 ~650 ppm; deep sea temperatures ~5 degrees C; sea levels tens of meters higher than at present) (Figs 5, 6). Trends in atmospheric CO2, temperatures, ice age phases and greenhouse phases in Earth history demonstrate close relations between atmospheric CO2 levels of below 500 ppm and glaciations (Figs 2 – 4).
There is no known precedence in the recent history of Earth for a rise in CO2 as fast as the current rate of 2 ppm/year. With an upper stability limit of the Antarctic ice sheet at about 500 ppm [1], the onset of ice melt at the margins of East Antarctica [2] raises the possibility Earth may be tracking toward ice-free conditions analogous to those of the late Eocene (>500 ppm CO2; +5 degrees C; +70 meters sea level). There is no knowing the time table towards an ice-free Earth, the current “experiment” by Homo sapiens being unique in the history of the planet.
The history of the Pleistocene (1.8 – 0.01 million years-ago) glacial-interglacial era is dominated by abrupt shifts in the state of the climate [3]. During this time gradual climate changes were repeatedly interrupted by abrupt tipping points, involving temperature shifts of several degrees over a few centuries, a few decades and even a few years [4]. The implications for an unstable, highly reactive, nature of the atmosphere are clear.
Having placed a man on the moon, split the atom, coded the DNA and created a World Wide Web, science and technology possess the ingenuity required for 11th hour attempts at climate change mitigation and adaptation, including bio-sequestration and CO2 down-draw techniques. However, the $trillion-scale funding needed to implement these methods continues to be poured into the military, casinos and games. A medieval state of mind appears to be manifest through a resistance to enlightenment and to science. Much like the grieving cycle of Helen Kubler-Ross, denial, resistance, anger and finally resignation alternate. Vested interests embark on massive well financed disinformation campaign, using mouthpieces who defy the basic laws of physics and often fabricate climate data. Governments undertake merely symbolic actions out of step with scientific projections of looming climate tipping points. None of the targets discussed in Copenhagen gets near the minimum effort required to reduce the increasing carbon emissions and deforestation.
What is referred to as climate change represents, in terms of Earth’s history, a Great Oxidation Event perpetrated by a Prometheans who assumed the mastery of fire. We may never understand the natural rationale for a species to cut and burn the forests from which it descended, proceed to dig and burn the fossil remnants of past biospheres and unconsciously render the atmosphere, the lungs of the Earth, unsuitable for its own future.
1. Zachos et al. 2001. Trends, rhythms, and aberrations in global climate 65 Ma to present. Science 292, 686–693; Berner R. A. 2004. The Phanerozoic Carbon Cycle: CO2 and O2. Oxford University Press, New York; Royer et al. 2004. Royer D. L. 2006. CO2-forced climate thresholds during the Phanerozoic. Geochimica et Cosmochimica Acta 70, 5665 – 5675; Royer et al. 2004. CO2 as a primary driver of Phanerozoic climate. GSA Today 14, 4 – 10; Royer et al. 2007. Climate sensitivity constrained by CO2 concentrations over the past 420 million years. Nature 446, 530 – 532; Zachos et al., 2008. An early Cenozoic perspective on greenhouse warming and carbon-cycle dynamics. Nature, 45: 279-283 17 January 2008; Royer D. 2008. Linkages between CO2, climate, and evolution in deep time. PNAS, 105, 407-408, January 15, 2008.
2. East Antarctic ice sheet may be losing mass http://news.bbc.co.uk/2/hi/science/nature/8371773.stm
3. Alley R. B. 2000. Ice-core evidence of abrupt climate changes. Proceedings of the Natural Academy of Science 97, 1331 – 1334; Broecker W. S. 2000. Abrupt climate change: causal constraints provided by the paleoclimate record. Earth-Science Reviews 51
4. Steffensen et al., 2008. High-resolution Greenland ice core data show abrupt climate change happens in few years. Science Express, 9.6.2008.
5. Keller, G. 2005. Impacts, volcanism and mass extinction: random coincidence or cause and effect? Australian Journal of Earth Sciences 52, 725 – 757; Glikson, A. Y. 2005. Asteroid/comet impact clusters, flood basalts and mass extinctions: significance of isotopic age overlaps. Earth and Planetary Science Letters 236, 933 – 937; Glikson, A.Y. 2009. Mass Extinction of Species: The Role of External Forcing. Journal of Cosmology, 2009, 2, 230-234.
6. Berner R. A. et al. 2007. Oxygen and evolution. Science, 316, 557 – 558.
Figure 1.
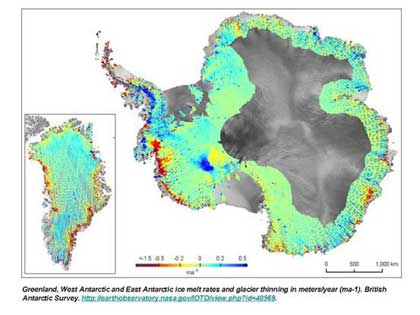
Greenland, west Antarctica and East Antarctica ice melt rates and glacier thinning in meters per year (ma-1). British Antarctic Survey. The red and purple areas represent ice melting at rates larger than 0.5 meters per year. Grey areas have no ice melt data.
Figure 2.
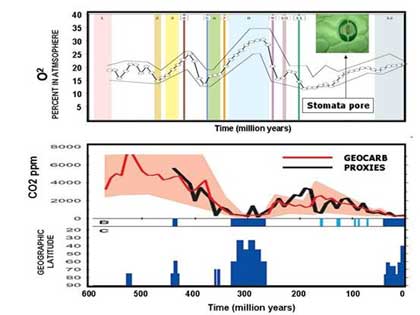
Variations in Oxygen and CO2 through the last 600 million years of Earth evolution. Note the concomitant decline in CO2 and increase in O2 during ice ages, and the opposite relations during greenhouse phases of Earth history.
Oxygen plot after Berner et al. 2007 [6]. CO2 plot after Royer 2004 [1]. The blue bars represent glacial periods, with heights corresponding to the latitudes the ice sheets reached.
Figure 3
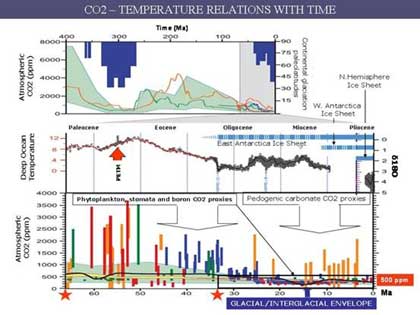
Paleo-CO2 and paleo-temperature plots for the periods 400 million year to the present and 65 million years to the present. Note the upper ~500 ppm CO2 boundary between glacial and greenhouse Earth climate conditions.
IPCC-2007 Chapter 6.
Top: Atmospheric CO2 and continental glaciation 400 Ma to present. Vertical blue bars mark the timing and paleo-latitudinal extent of ice sheets. Plotted CO2 records four major proxies.
Middle: Global compilation of deep-sea temperatures based on 18O of fossil plankton from 40 Deep Sea Drilling Program and Ocean Drilling Program sites.
Bottom: Detailed record of CO2 for the last 65 Million years. Estimates based on soil nodules have high uncertainty.
Figure 4.
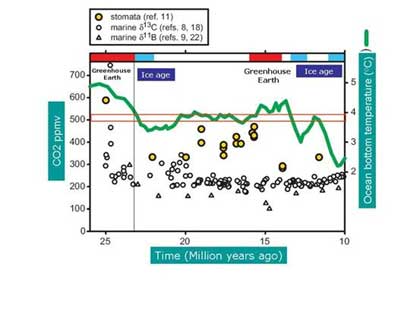
Atmospheric CO2 and ocean bottom temperatures for the period 25 – 10 million years ago (Oligocene-Miocene). Paleo-temperatures are based on 18O and Ca/Mg ratios; Paleo CO2 levels are based on Stomata (fossil leaves pores), carbon isotopes and boron isotopes. Royer, 2008. PNAS, 105, 407-408, January 15, 2008 [1].
Figure 5.
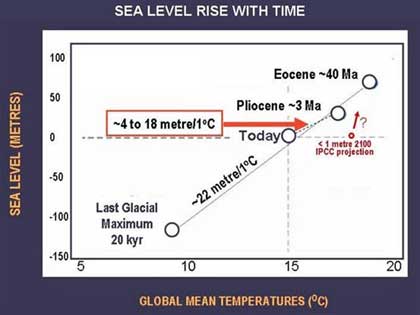
Sea levels relative to mean global temperatures in the Eocene (>34 million years ago), mid-Pliocene (~3 million years ago), at present and during the last glacial maximum (20,000 years ago). After Rahmstorf, 2005. Climate Change Fact Sheet Potsdam Institute for Climate Impact Research ( www.pik-potsdam.de/~stefan)
Figure 6.
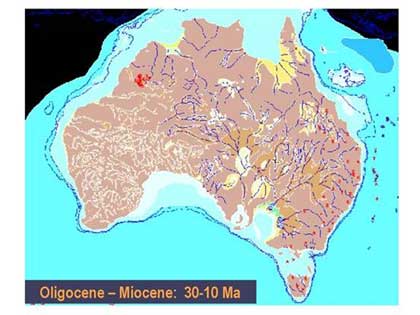
Paleogeographic map of Australia during the Oligocene – Miocene (~30 – 10 million years ago), showing land areas (brown) and sea covered areas (light blue). Australian Paleogeographic Atlas, AGSO.
By Andrew Glikson
Earth and paleoclimate scientist
Australian National University
[email protected]