

2015: Is It The Year Marcellus Shale Gas Peaked And Then Began Falling As Fast As It Rose?
By Nicholas C. Arguimbau
21 May, 2015
Countercurrents.org
How easy it is to forget there are limits to growth, especially when what you observe is designed to make us forget. The great Marcellus is famous for having increased its production 12-fold in four years to become the US' largest producing natural gas field, but things have not looked that great lately. The average daily production estimate reported by EIA in January was 16319, in February was 16550 a gain of 1.4%, in March was 16600, a gain of 0.3% in April has been 16706, a gain of0.9% and is projected to be 16716 MMcf/d in May, a gain of 0.06%. Not a stellar performance.: a gain of 2.4% in 4 months, most of that at the beginning. Any bets that it will be going down by July? Where is the mighty Marcellus?
There are recent projections of Marcellus growth that show production or slow fall-off in coming decades, such as that of David Hughes, "Drilling Deeper," http://www.postcarbon.org/wp-content/uploads/2014/10/Drilling-Deeper_FULL.pdf and the EIA analysis discussed by Hughes, that predict that far more gas will be produced there in coming years and decades than the USGS says are technically available. Compare http://www.usgs.gov/newsroom/article.asp?ID=2893/ They make no attempt to reconcile their concluions with those of USGS They are in effect making rosy projections based upon the ability of Marcellus to keep on growing and producing through technology that doesn't presently exist and of which they do not tell us the nature. Addtionally, what is ecoomically avilable is is generaly substantially less than what is technically available. You cannot produce gas you don't know how to produce, and you cannot produce gas you cannot afford to produce. Those who say Marcellus will go one being "mighty" ignore, as we shall see, these basics.
And there is a famous Marcellus production chart done by Mark Perry using numbers from the US Energy Information Agency (EIArom EIA data showing growth by a factor of 12 in four years.
https://www.aei.org/publication/chart-of-the-day-the-amazing-12-fold-increase-in-natural-gas-production-in-the-marcellus-shale-in-just-four-years//
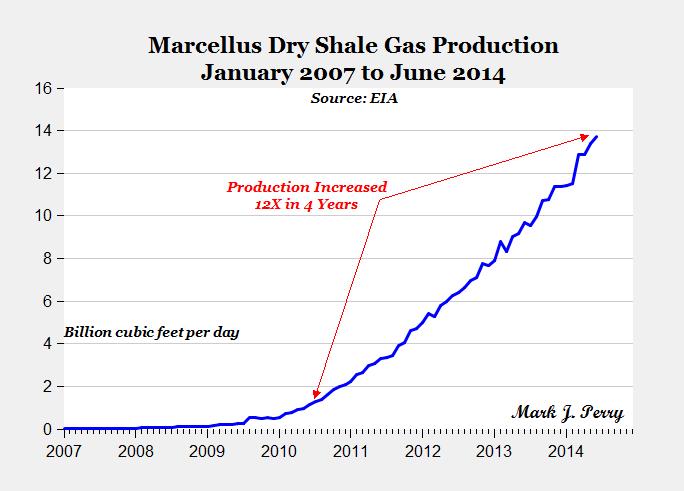
The Perry chart, of which no one doubts the accuracy (Hughes pointed out to this writer that EIA's practice and apparently a reason to question the chart,,is to compile data for the "Marcellus region" rather than the Marcellus field alone, and that is what is shown here; no one else challenges the chart in any way.), superficially looks like an exponential growth chart with no end in sight. It is Exhibit A for Shepstone, "The mighty Marcellus is unstoppable," http://oilpro.com/post/6330/mighty-marcellus-unstoppable, but if you take another look, the chart reveals that the unstoppable Marcellus is about to stop and has been sending out warning signs for yearts. If you look closely the last several years show the following growth rates:
2011 86%
2012 60%
2013 40%
2014 29%
And guess what it has been telling us for years comes next? The growth rate has been steadily dropping by close to a fixed percentage of 20% each year. so the definite trend makes 2015 the zero-growth year, and gives Marcellus that status independent of any transient slumps that may be lurking in the background. Peak Marcellus. (When a growth curve appears, as most do, to be exponential, it is sensible and conventional to look at the percentage rather than absolute growth rate, the way we do with the GDP, the stock market, bond interest, etc.. For a radically different take, using the absolute growth rate, see Richard Zeits OIL ANALYTICS Newsletter, "Marcellus Shale: A 20 Bcf Per Day Natural Gas Tsunami," http://seekingalpha.com/article/1949421-marcellus-shale-a-20-bcf-per-day-natural- gas-tsunami But with that way of looking at things, he couldn't and didn't see that Maarcellus would be dead in the water this year.This is not the first suggestion, however, that a peak is imminent.. See "'Expert' [Bill Powers\ Predicts Marcellus Production Will Peak in 2015," http://marcellusdrilling.com/2015/04/expert-predicts-marcellus-production-will-peak-in-2015/, Powers, *The Marcellus Is Close To Peak Production - Here's Why This Is So Important," http://seekingalpha.com/article/3055756-the-marcellus-is-close-to-peak-production-heres-why-this-is-so-important, The Powers analysis is not in any way based upon this chart; but he does note that parts of the Marcellus are already in decline. 2015 as peak Marcellus is now showing up in actual production data.The month-over-month change in daily production is predicted by the Energy Information Agency to go up by 0.05% May over April this year, the equivalent of a 0.6% annual rise. Right on target for the trend of the last four years.. Four years ago that would have been 80%! Production increasing from new wells is only marginally offsetting declines from existing wells, so Marcellus is on, as it is called, a "treadmill," a well-known characteristic of stagnant and declining shale- gas plays - new wells still cost dearly but are no longer adding net new production. See EIA "Marcellus Region
Drilling Productivity Report April 2015," http://www.eia.gov/petroleum/drilling/pdf/marcellus.pdf The trend of quickly dropping growth rates has continued for several years without regard to price or demand, so any particular economic or technological factor in a particular year cannot explain the trend. Exacerbation yes; cause no. If we can extrapolate the trend, Marcellus will drop 20% in 2016, 40% in 2017, and so forth, and the "Marcellus Region's" entire production (including by definition parts of Utica) would be less than 2 billion cubic feet daily by 2019... The curve depicting the "unstoppable Marcellus" is in fact the depiction of a Gaussian bell-shaped curve on its upslope, with peak 2015 (In mathematical terms,d/dt(exp(-rt**2)/(exp(-rt**2) = -2rt. In words, a Gaussian bell-shaped curve has this tell-tale characteristic: the rate of increase drops linearly, positive before the peak and negative after the peak, the same drop each year) . A Gaussian is symmetrical on the two sides of the peak; that is, it drops as fast as it rises. Assuming the Marcellus growth curve is as much like a Gaussian as it appears, the decline rate will hit -20% in 2016, -40% in 2017, and so forth. Others have seen fit to use Gaussians to describe natural gas production, so there is precedent. Ugo Bardi, Club of Rome, The Shale Gas Revolution: is it already over?, http://www.clubofrome.org/?p=6395 And around the end of 2019, the first year of full operation of the Kinder- Morgan Northeast Extension pipeline, which has a design capacity of 2 billion cubic feet per day, Marcellus' entire production will likely be down to that number and rapidly dropping, . L. David Roper an analyst from Virginia,
facing a much more modest scenario than suggested here,asks, "Is Marcellus play too near its peak to justify three huge new pipelines [in addition to the K-
M pipeline]?" http://www.roanoke.com/opinion/letters/roper-is-marcellus-play-too-near-its-peak-to-justify/article_17d1dfa6-1006-5bf4-b4b9-9eb5a89c8e53.html. The K-M pipeline would travel across the most pristine natural area of Massachusetts including this writer's hometown, extraordinary in that it is replete with eagles, moose, bears, beavers, coyotes, wildcats and deer, and numerous rare plant species, despite the state as a whole from end to end having a population density averaging approximately 1100 per square mile, 10% greater than the present population density of India, http://www.worldometers.info/world-population/india-population/.
There is far more than the apparent Gaussian nature of the Marcellus growth curve pointing to a very rapid post-peak decline of the US' largest and the world's second-largest natural gas field, information that has surfaced only in the last two months and was unavailable to Hughes when he published his scary-enough analysis in September. 1. Rig counts can drop with improvements in technology, and that has occurred in the past with Marcellus, but there
is no corresponding technology improvement known to this writer to explain the dramatic drop in rig counts which has just occurred in the Marcellus. and in the absence of technological changes, a rig count drop corrsponds to a future production drop. Fewer rigs means fewer active wells, and fewer active wells means less gas. The rapid decline predicted by a Gaussian curve fits the fact that Marcellus rig counts are "falling of a cliff."
http://marcellusdrilling.com/2015/03/intl-rig-counts-in-free-fall-what-about-marcellusutica-counts/
The Marcellus rig count droped from December to FebruaryThat's a drop in rig counts of 25% in three months, which will very quickly result in roughly a substantial drop in production. The rig count drops are continuing.
The rig count is as of May 15, 2015, 66 (personal communication from BakerHughes), DOWN FIFTY PER CENT in the five months Decenber to May. Then there are major drops taking place in the capital budgets of some of the larger shale gas operators in the Marcellus region.. Marcellus.com,
From last year, capital budgets for specific major players at Marcellus are down 20% for Antero Resources, 58% for Cabot Oil and Gas, 50% for Carrizo Oil and Gas, 75% for Chesapeake, and 18% for Enerplus. http://www.shaleexperts.com/plays/marcellus-shale/capital_exp_2015?landingPage. The very sharp decline rates for fracked natural gas wells (a typical Marcellus well is said to decline 47% in its first year,66% in its second year and 71% in its third year, with negligible production thereafter, Hughes, Drill Baby Drill, http://shalebubble.org/drill-baby-drill/ Consequently, field production drops off esssentially at the decline rate of an individual well when new wells aren't being drilled. So a rapid decline of Marcellus production appears, on the face of it to be inevitable. Similar events are occurring in the industry elsewhere in the country, but Marcellus has previously been immune to cutbacks taking place elsewhere in the industry, and the steady 20% decline per year in the rate of production increase belies a transient explanation in the case of Marcellus.
In short, here’s where we are:
1. The rig count as of May 15, 2015, is down from 132 in Decenber, to 66, precisely 50% in five months
2. Capital budgets of the drilling companies are down typically 30%..
3. Drilling permit applications for the Pennsylvania Marcellus are down thirty per cent for the year to date from 2014
Another significant piece of support for the analysis here comes from the USGS study of technically recoverable gas from the Marcellus: 84 trillion cubic feet. Hughes and EIA, in forecasting future production from Marcellus ignored that ceiling and predicted ultimate production far in excess of 84 trillion cubic feet, with no explanations of why the USGS figure should be discounted. Moreover, "economically recoverable" gas is far less than "technically recoverable" gas." Although US "shale revolution" operators have shown their willingness from the start to go forward with shale development that doesn't pay for itself. The history of Chesapeake's shale gas operations tells the whole story. The gas it was producing didn't even pay for the wells producing it, let alone pay for the endless construction of new wells to replace declining ones. Like every operator, it had to drill a replacement well for every well it owned every roughly three years just to hold its place on the treadmill. New wells are $7.8 million a pop, or so it is estimated by serious students of the question. See elow. That's just the cost of staying in a game for which there are no wins in sight. What happens if you can expect to run out of gas before you can expect to get a high enough price to win? You quit. "Peak Marcellus" seemingly warns you that that day is not far off.
For starters, maybe we can assume tha operators are now going to get serious about trying to stick to "economically recoverable" gas. So how much recoverable gas is there in the Marcellus at present break-even prices? Those who know don't say, and those who say don't know. The sayers of course include this writer, who is not even close to being an expert, just a retired lawyer who lives off in the woods. However, maybe there's a way to make an educated guess. Kenneth Medlock, SENIOR DIRECTOR, CENTER FOR ENERGY STUDIES, JAMES A. BAKER III INSTITUTE FOR PUBLIC POLICY RICE UNIVERSITY, in a recent white paper for the Umiversity of Califormnis Davis, Figure 7, "NORTH AMERICAN RESOURCES AND NATURAL GAS SUPPLY TO THE STATE OF CALIFORNIA," http://steps.ucdavis.edu/files/02-19-2015-North-American-Natural-Gas-Resources-and-Supply-for-CA-ITS-
Davis.Baker-Inst-18Feb2015.pdf, has produced a graph (Figure 7) of recoverable gas as a function of break-even price; the price has varied wildly over the peiod since Marcellus "took off," but this writer will use $3.30/Mcf as a reasonably representative figure - the average at the end of 2012, half way through Marcellus' astopnnishing rise. See chart at http://www.marcellus-shale.us/natural-gas-prices.htm. If they choose to go on playing, they are REALLY going to lose their shirts drilling new wells.) The 34tcf figure has to have subtracted out the approximately 17tcf Marcellus will have produced by the end of 2015 to get what it has yet to produce. That figure is therefore also17 tcf (gotten by eyeballing the Perry chart. Huh. This is embarrassing - things don't generally fit that well in the real world Equal production pre-peak and post-peak? "Of course, it's a Gaussian curve," I say to myself.
One difficulty predicting what is going to occur in a shale gas field is that an important difficult-to-model and difficult-to-talk-about factor is that to many companies, real estate speculation is in fact more important than gas sales. A look at the cutbacks at Chesapeake gas and how they occurred reveals that the need to "flip" drilling properties was a major factor with the company. When a play is no longer rapidly growing, the growth of real estate prices in the play is also going to slow or halt. This means that peaking becomes an incentive to get out of the business while land values are still inflated. This can be seen to be a factor in Chesapeake's abandonment of shale gas. The real estate factor is seems to be generally ignored by those tryhing to ascertain Marcelluus' future. See Hughes' "Drilling Deeper" and What is bizzarre about the prcess f predicting Marcellus’ future .s that one wants to use a model in which the operators will stop drilling when it is no longer in their financial interest to do so. But if one starts there, then there is no reason they would havve started in the first place. They have never been able to get their wells to pay for themselves. None of the experts have suggested a sensible motivation; they don't talk about real estate speclation. It has been a losing proposition from Day One, yet a losing proposition that mulyiplied itself by 12 in four year with great enthusiasm. You don’t tell potential investors or lenders or the press that you are engaged in a losing proposition and lose more money fastrer, the faster Marcellus grows. Those who know don’t say; those who say don’t know.
The University of Pittsburgh has performed a professionally competent calculation of the cost of a Marcellus well, and have put the number down as $7.6 million. “How Much Does it Cost to Drill a Single Marcellus Well? $7.6M,” Marcellus Drilling News, http://marcellusdrilling.com/2011/09/how-much-does-it-cost-to-drill-a-single-marcellus-well-7-6. That number begins to permit us to get a rough picture of Marcellus economics. The operators have drilled 6630 wells to date, at a total cost of $50.4 billion. The wells have brought in gas at a price around $3.30/Mcf or $3.3 billion/tcf, and have, by eyeballing Mr. Perry’s famous chart, produced 15 tcf worth $49.5 billion. So the cost of the wells and the value of the gas they have thus far produced is about the same. It is generally perceived that the breakevenprice of gas is MUCH higher than what is necessary to pay for the wells.The operators, following the mandate of Wall Street that they produce as much gas as possible without regard to their flooding the market, pulling down the price, and thereby giving the operators the minimum return for the maximum output, have apparently netted the approximate cost of the wells with nothing left over for other costs such as paying their employees and feeding their families. They must be tired and broke, seeing no certain future when their wells can pay for themselves. On top of that, they must see their speculative investments in natural gas leases rapidly disintegrating, because who wants to buy into a stagnating enterprise? Finally, even if they wished to continue punishing themselves, they are likely to be finding their funding sources drying up, with less money every day for building new wells. Hence the 50 % cuts in rig counts and 30% cuts in capital budgets.
In the end, we can speculate all we want about the causes, but it is difficult to envision any direction Marcellus could be going but down, and fast. Someone was REALLY determined to make Marcellus a super-producer, literally at all costs including its own long-term economic health. Wall Street, apparently bundled leases like the mortgages of yore, and sold the stock to unsuspecting retirement funds, yet again bilking the remains of the middle class. And when someone tries to resuscitate the mighty Marcellus to provide a “bridge fuel” to heat the homes of New England, he or she will find it highly damaged because the best pickings will already have been taken, and the world of investors wlll be “once burned, twice shy.” We can sit in the cold and the dark, contemplating who if anyone made the mighty Marcellus to create the temporary illusion of a “shale revolution,” and then killed it.
And whether the same decision makers have been responsible for simultaneous events in shale oil. It should be noted that virtually identical events are occurring in the field of shale oil, virtually simultaneously and for all the world as if planned that way. Here, for example, is the chart of shale oil rig counts , which have gone down by half in the five months from December 2014 to May, 2015 , just the same as the shale gas rig count: down by half in the five months from December 2014 to May 2015.http://finance.yahoo.com/news/may-8-us-oil-rig-170207320.html;_ylt=AwrXgiNuxVxVBToAE8_QtDMD;_ylu=
X3oDMTByb2lvbXVuBGNvbG8DZ3ExBHBvcwMxBHZ0aWQDBHNlYwNzcg–
It does not look as if there will be any shale rig left, either for oil or for gas, by the end of 2015, does it?
The 2015 shale oil collapse will be exacerbated by the powers that be having included within the public definition of “oil,” the component of natural gas known as “natural gas liquds,” small-molecule gaseous hydrocarbons found in natural gas that are liquids at arctic temperatures, so the crash in “oil” will be in part inseparable from the crash in natural gas.
The good fit of the Marcellus production curve to a Gaussian suggests that the dropoff will be as rapid as the rise. And so do the recent activities of the operators, scurrying for cover. Time will tell - and not very much time, at that.
The author is a retired lawyer residing in Western Massachusetts, with degrees in physics from Harvard and law from UCLA, who concentrated on environmental and death penalty cases, and now concentrates on photography and on-line writing. You will get most of what he has written by Googling ["Nicholas C. Arguimbau" Countercurrents].
Tags
.
Comments are moderated