Abstract
The review article discusses the condition of Air Quality and Pollution in India with relevant references from prominent sources like The Environment Performance Index 2016, The Global Green Economy Index (GGEI) 2016, Ambient Air Pollution Database, WHO, May2016, Clear the air for children: The impact of air pollution on children UNICEF 2016 and many others. It comprehensively studies the condition of Air pollution in India in present and future context along with the sources of the pollution, its impacts on health & environment, economic damage caused and brief explanation on how to tackle with it.
Introduction
The 2016 Environmental Performance Index[i] ranked India 141 out of 180 countries surveyed. EPI is unique in its approach because it incorporates many high-priority environmental issues, including resource consumption, depletion of environmental assets, pollution, and species loss among other important topics[ii]. The EPI typically ranks countries on performance indicators tracked across policy categories that include both Environmental Public health (protection of human health) and ecosystem vitality (protection of Ecosystems). Within these two policy objectives, the EPI scores national performance in nine issue areas comprised of about 19 indicators[iii]. Environment Health, being the first policy objective, is given 50% weightage and it comprises 3 categories viz. health impacts, Air Quality and Water & Sanitation each given 33% weightage in the score within; whereas Ecosystem Vitality, being the second policy objective, is again given 50% and it comprises 6 categories viz. Water resources(25%), Agriculture (10%), Forests (10%), Fisheries(5%), Biodiversity & Habitat(25%) and Climate & Energy(25%). A very interesting observation is that China and India, despite having high GDP per PPP, have received low scores on the EPI[iv]. However, we will be studying the issue area Air Quality in Indian context.
Study of Air Quality in India
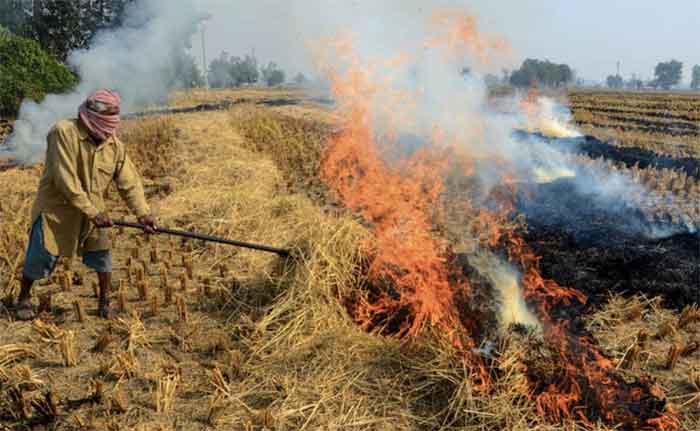
The open burning of waste is a large source of toxic air pollutants such as particulates, carbon monoxide, black carbon, dioxins, furans, and mercury[v]. Air pollution in India is caused by fuel wood and biomass burning, burning of crop residue in agriculture fields in large scale[vi], use of adulterated fuel, emission from vehicles and traffic congestion. India is the third largest in the emissions of greenhouse gases after China and the United States. The severity of air pollution is so much that life expectancy among Indians on an average reduces by 3.4 years while among the residents of Delhi it reduces by almost 6.3 years[vii].
In this section, we will assess the Quality of air in India based on indicators like Household Air Quality and Outdoor Air Quality affectedby PM10, PM2.5, Ozone (O3), Nitrogen oxides (NOX), Sulphur dioxide (SO2) and Carbon monoxide (CO).It has been found that, around the world, more deaths occur due to poor air quality than water. The World Health Organization (WHO) gives a guideline[viii] to measure air pollution in a region according to which it had fixed the limit of particulate matters in the air;
| O3 | 100 μg/m3 (8-hour mean) | |
| PM2.5 | 10 μg/m3 (annual mean) | 25 μg/m3( 24-hour mean) |
| PM10 | 20 μg/m3 (annual mean) | 50 μg/m3(24-hour mean) |
| NO2 | 40 μg/m3 (annual mean) | 200 μg/m3 (1-hour mean) |
| SO2 | 20 μg/m3 (24-hour mean) | 500 μg/m3 (10-minute mean) |
The World Health Organization considers air unsafe when average exposure to any of these matters exceeds the limit. According to the 2016 EPI, more than 3.5 billion people – half of the world’s population – are exposed to unsafe air quality which also includes 75% of India’s population. However, Indian air quality standard limits the safe exposure to PM2.5 up to 40 μg/m3 and a recent study reveals that 50% population living in 45% districts of India is exposed at PM2.5 concentration beyond 40 μg/m3[ix].
As some indicators are common for indoor as well as outdoor pollution so to understand clearly, first we need to know what these indicators really are.
Particulate matter (PM) is a complex mixture consisting of varying combinations of dry solid fragments, solid cores with liquid coatings and small droplets of liquid. These tiny particles vary greatly in shape, size and chemical composition, and can be made up of many different materials such as metals, soot, soil, and dust[x]. Particulates are highly carcinogenic and have been classified in Group I carcinogen[xi] because of their ability to penetrate deep into the lungs and blood streams. They can also cause permanent DNA mutations, heart attacks, and premature death.
PM10 is roughly one-seventh the diameter of a normal human hair. PM10 is a major component of indoor air pollution and forest fires. It consists of sulfate, nitrates, ammonia, sodium chloride, and black carbon; it may also include concentrations of natural windblown dust. PM10 is harmful to health because it can block and inflame nasal and bronchial passages, causing a variety of respiratory-related conditions that lead to illness or death. The European Study of Cohorts for Air Pollution Effects (ESCAPE) published in 2013 stated that with every increase of 10 μg/m3 in PM10,the rise of 22% in the lung cancer was observed.
PM2.5 is often produced by biomass and fossil fuel combustion as well as natural sources such as windblown dust and volcanic activity. It is often considered even more dangerous to human health because of its ultrafine size and ability to cause several diseases related to lung and heart. With every increase of 10 μg/m3 in PM2.5 concentration, 36% increase in lung cancer was also observed (ESCAPE, 2013).
Ozone (O3), an important ingredient of smog, is a highly reactive and unstable gas capable of damaging the linings of the respiratory tract that can cause lung inflammation, shortness of breath, chest pain, wheezing, coughing and exacerbation of respiratory illnesses such as pneumonia and asthma. Long-term exposure has been linked with chronic respiratory illnesses. Approximately 142,000 people died as a result of exposure to ozone in 2010 –an increase of about 6 per cent since 1990.
Nitrogen oxides (NOX) are one of the principal pollutants that result from fossil fuel combustion. It helps in the formation of ozone and also causes several chronic diseases.
Sulphur dioxide (SO2) is a colorless gas with a very sharp odour formed with the combustion of sulfur-based coal and oil.Sulfur dioxide can form Sulphuric acidic upon combination with water and can cause acid rain. SO2 can also cause respiratory and cardiac diseases which lead to increased mortality rate.
Carbon monoxide (CO) is a colorless, odourless gas, produced mostly by vehicles, fuel combustion boilers and incinerators. It can cause headaches, visual impairment, reduced cognitive functioning and ability, and reduced ability to perform complex tasks. Very high levels can also result in unconsciousness and eventually death.
Household Air Quality
Indoor air pollution is among the top five environmental health risks[xii]. According to various studies, household air pollution causes more deaths than outdoor with researchers even emphasizing that 40 per cent of all the diseases burden can be attributed to household air pollution[xiii].
In 2012, indoor air pollution was linked to 4.3 million deaths globally, compared with 3.7 million for outdoor air pollution[xiv]. In another survey done the sameyear, it was found that Indoor and outdoor air pollution claimed at least 40,000 UK lives a year with a total damaging cost of £20bn[xv].In India, too, the death due to indoor air pollution amounts to 300,000 to 400,000[xvi].
Artemis hospital conducted a survey which found that 76per cent of the offices and houses in National Capital Region have unhealthy air quality and 34 percent of people staying indoors have respiratory problems[xvii].
Solid fuels are the biggest contributor to the deterioration of household air quality. It is estimated that 25-30% of primary particle pollution in India is from household fuels (Chafe, 2010). Over 1 billion children live in homes where solid fuels are used in cooking and heating and in India about 64% population[xviii] use solid fuels with high PM2.5 production (see fig 1).

A study in Andhra Pradesh, India, found that solid fuel use created a mean 24-hour average concentration of particulate matter that ranged from 73 to 732 μg/m3[xix]. Guidelines from the WHO indicate that it shouldn’t exceed 10 μg/m3[xx]. National exposure models, developed for solid fuel using household-level average estimates of PM 2.5, has found following results[xxi]:
| Average Exposures (24 hours) | |
| Women | 337 μg/m3 |
| Men | 204 μg/m3 |
| Children | 285 μg/m3 |
Outdoor Air Quality
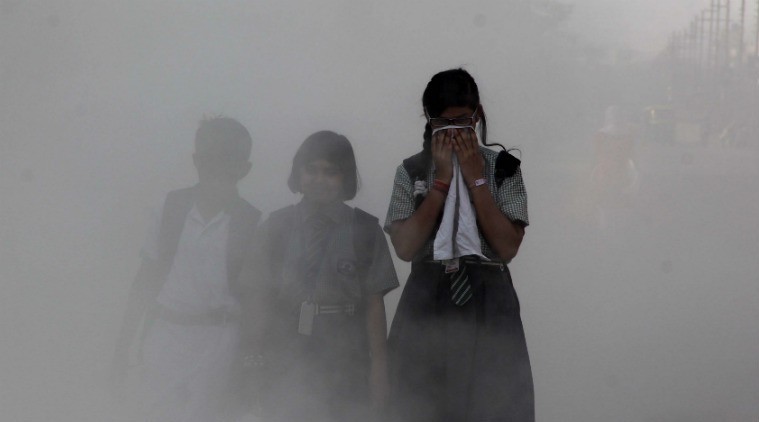
Outdoor air pollution is also considered Group I carcinogen. Many types of research show that pollution is not only the national problem of India but also the problem of whole South Asia. India is surrounded by highly polluted neighboring countries like Pakistan[xxii][xxiii] Bangladesh[xxiv][xxv] China[xxvi], Nepal[xxvii], Tibet[xxviii]Bhutan[xxix] and Sri Lanka. Sri Lanka has performed best in South Asia with the rank 108th in 2016 EPI. Around 2 billion children live in areas where outdoor air pollution exceeds international limits. Almost 300 million children live in areas where outdoor air pollution is toxic – exceeding six times international limits. WHO reports, also suggestthat urban outdoor air pollution has increased by about 8 per cent between 2008 and 2013. It has also been found that in 2012 approximately around 127,000 children under the age of 5 died from outdoor air pollution in 2012 while 531,000died from household air pollution.
China and India have time and again been observed as areas where air pollution is at its worst.
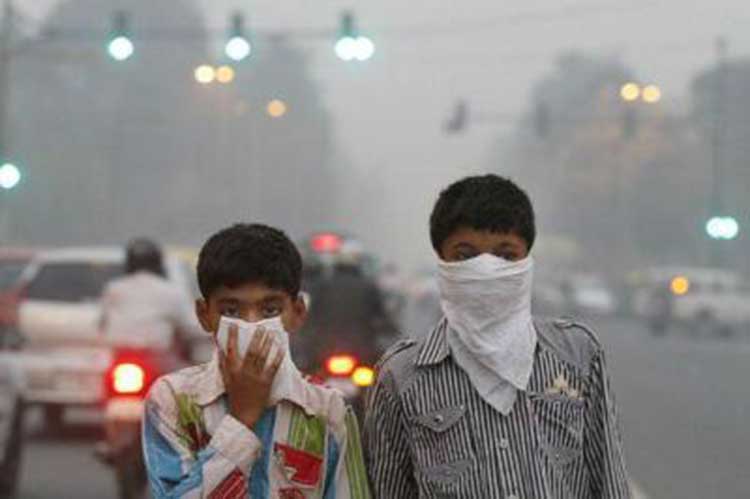
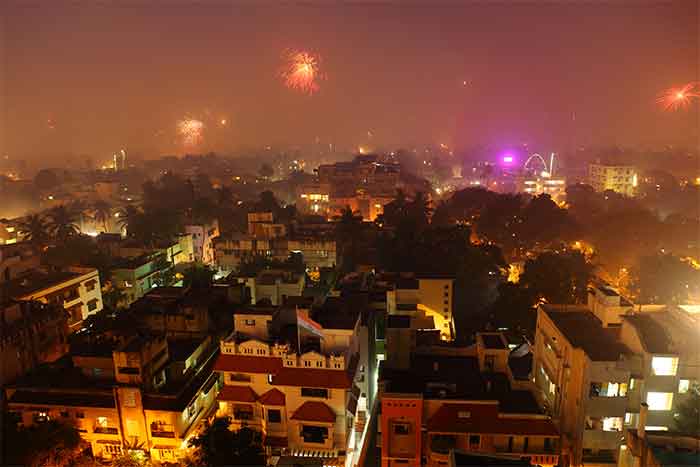
PM 2.5 and PM 10: On October 31st, 2016, the day after Diwali, Delhi witnessed severe air pollution which was 14-16 times higher than the safe limit prescribed. On the basis of the data retrieved from the Central Pollution Monitoring Agency, concentrations of Particulate Matter or PM 10 (coarser pollutants) was found to be around 1,600 micrograms per cubic metre against the safe level of 100 at around 2 am in Delhi’s AnandVihar and PM 2.5 was 14 times the safe limit[xxx]. Following nine days from November 1st till November 9th, Delhi saw its worst smog very similar to the Great London smog, and is also named as Great Delhi smog.Infact, according to ‘Ambient Air Pollution Database, WHO, May 2016[xxxi], India has 13 cities in worlds top 20 most polluted cities with Delhi leading the pack along with Patna, Gwalior, and Raipur respectively. Of 1215 most polluted cities recorded, 133 were Indian with 31 in top 100 most polluted cities. Figure 2 shows PM10 concentration in various mega-cities of the world.

Carbon emission: India has seen an increase of 137% in the carbon emission from 2001 to 2013 while China has observed an increase of 191%[xxxii]. Again from 2014-2016, carbon emission increased in India by 2%. Between 1971 and 2014, total CO2 emission in India has increased by more than 1100% with 181 million tons in 1971 to 2190 million tons in 2014. In 2014, carbon emission from India accounted for 6.78% of total global emission[xxxiii].
Nitrogen Oxides: From 1997 to 2011, NO2 emission in India increased by 28% while Nitrogen Use Efficiency decreased by almost 32%[xxxiv].
Sulphur Dioxide (SO2): According to recent studies it was found that SO2 emission in India from 2005-2012 increased by 71% while the SO2 burden on the environment increased by 63%[xxxv].
Consequences of Air Pollution
There is concrete evidence that air pollution leads to low birth-weight, tuberculosis, ischemic heart disease, cataracts, asthma and nasopharyngeal and laryngeal cancers. New research has found that air pollution might also affect cognitive development. PM2.5 are so small that when inhaled they can enter the bloodstream,and recent medical research indicates that it can cause thedegeneration of blood-brain barriers, leading to oxidative stress,neuro-inflammation and damage of neural tissue. Air pollution is linked to diseases and infections that kill around600,000 children under 5 years of age per year[xxxvi]. A study even shows that about 2.2 million school children in Delhi are growing up with irreversible lung damage which they will never recover[xxxvii].
The number of premature deaths due tooutdoor air pollution is projected to increase from3 million people globally in 2010 to a global total of6 to 9 million people in 2060. The number of cases of bronchitis is projected to increase substantially, going from 12 to 36 million new cases per year for children aged 6 to 12 and from 3.5 to 10 million cases for adults[xxxviii].
Total welfare losses due to air pollution in India amounted to more than 500 billion USD (~8.5% of country’s GDP) in the year 2013 (381% increase from 1990)[xxxix]. Total welfare costs of air pollution in the world is expected to increase from 3160 billion USD in 2015 to 18300 – 25330 billion USD in 2060 (as per 2010 PPP exchange rates)[xl].
Solutions
Three basic strategies to reduce pollutant concentrations in indoor air are source control, ventilation, and air cleaning. Under source control,we can reduceemissions through the use of cleaner fuels, such as liquid petroleum gas and electricity. Under ventilation, air is exchanged between the inside and outside of a building throughthe introduction of outdoor air. Air cleaning can be done with the help of mechanical air cleaners. Planting trees as much as possible might help in tackling air pollution in general. Some policies and measures suggested by OECD are making pollution more costly than greener alternatives, removing environmentally harmful subsidies, devising effective regulations and standards, encouraging green innovation and integrating environmental objectives in economic and sectoral policies etc[xli]. Using public transport instead of private will also help mitigate pollution. The government has agood option of local and metro trains based on electricity to reduce carbon load as id evident by the case of The Delhi Metro.One study shows that each extension of the metro rail resulted in a decline in nitrogendioxide and carbon monoxide in Delhi. The estimates for nitrogen dioxide reductions rangedfrom 3 to 47 percent, while those for carbon monoxide rangedfrom 31 to 100 percent[xlii].
Conclusion
Various reports like The Environment Performance Index 2016, The Global Green Economy Index (GGEI) 2016, Ambient Air Pollution Database, WHO, May2016, Clear the air for children: The impact of air pollution on children UNICEF 2016 and many others suggest that India is oneof the most polluted countries in the world.
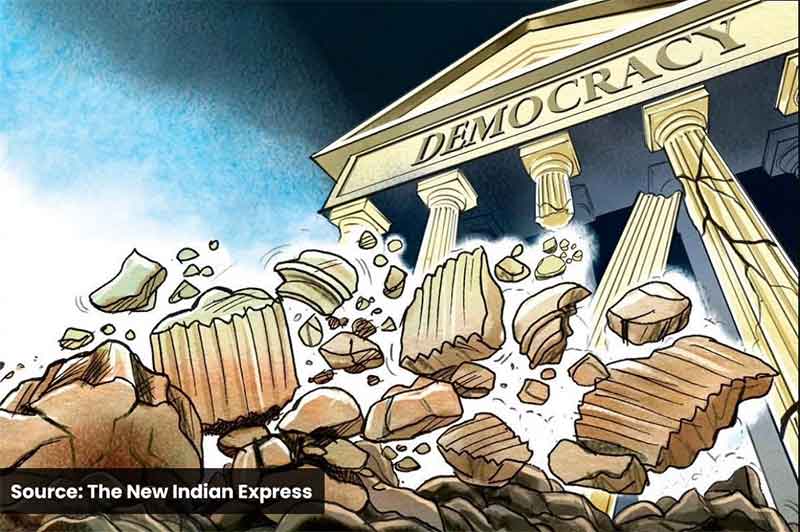
India, inspite of being better in GDP per PPP than many countries, has done very poor in the 2016 EPI. Infact, if we compare the 2016 EPI reports with 2016 Global Peace Index (GPI)[xliii] in which India (coincidentally and interestingly) again ranks 141[xliv]; we observe that India has done worse than various less peaceful countries like Iraq, Nigeria Libya, Ukraine, Egypt, Syria and several others in overall EPI. This brings us to the construe the fact that it is the willingness of the government rather than its GDP or stability to act against pollution.
Not any major initiative has been taken by the Indian Government to tackle the air pollution. Swachh Bharat Abhiyan (Clean India Mission) was launched by Government of India on October 2nd, 2014 to reduce the pollution but exactly one week before on September 25th, 2014; Government also launched “Make in India Initiative” which hopes to make India a production hub. Production will also mean putting our already vulnerable environment further at risk. The government needs to understand that “Swachh Bharat” and “Make in India” cannot go hand in hand. Rather, Central Government along with the State Governments should create and launch strict policies and measures to cope with the menace called Air pollution.
India, on October 2nd, 2016, has ratified the Paris Agreement with the aim to deal with greenhouse gases emissions mitigation, adaptation, and finance starting in the year 2020. Decalaration[xlv], as given by the government, is
“The Government of India declares its understanding that, as per its national laws; keeping in view its development agenda, particularly the eradication of poverty and provision of basic needs for all its citizens, coupled with its commitment to following the low carbon path to progress, and on the assumption of unencumbered availability of cleaner sources of energy and technologies and financial resources from around the world; and based on a fair and ambitious assessment of global commitment to combating climate change, it is ratifying the Paris Agreement.”
India has also recently unveiled largest solar panel facility in the world at Kamuthi, Tamil Nadu which has a capacity of 648 MW and covers an area of 10 sq km[xlvi]. In a bid to curbe air pollution in National capital Region, Supreme Court banned the sale of firecrackers[xlvii]. Badarpur Thermal Power Plant was also ordered to stop functioning till January 31st, 2017. For a few days all the construction works were also ordered stop[xlviii]. Let’s hope that government follows its agreement and work towards making the world much cleaner and saferplace to live in.
HanzalaAman is a writer based in New Delhi. He has studied Agriculture Sciencesfrom SHUATS, Allahabad. He currently freelances as a writer and Hindi-Urdu-English translator.
References:
[i]The 2016 Environmental Performance Index is a project led by the Yale Center for Environmental Law & Policy (YCELP) and Yale Data-Driven Environmental Solutions Group at Yale University (Data-Driven Yale), the Center for International Earth Science Information Network (CIESIN) at Columbia University, in collaboration with the Samuel Family Foundation, McCall MacBain Foundation, and the World Economic Forum.
[ii]Hsu, A., L.A. Johnson, and A. Lloyd. 2013. Measuring Progress: A Practical Guide from the Developers of the Environmental Performance Index (EPI). New Haven: Yale Center for Environmental Law & Policy, pp. 5-6
[iii]The 2016 Environmental Performance Index Report p. 11
[iv]The 2016 Environmental Performance Index Report p. 116
[v]Rees,Nicholas . October 2016. Clear the air for children: The impact of air pollution on children. UNICEF p. 34
[vi] http://earthobservatory.nasa.gov/NaturalHazards/view.php?id=79630
[vii]Mascarenhas, Anuradha. New Delhi.June 7, 2016.Delhi residents lose 6.3 life years from exposure to PM 2.5: Study. Indian Express
[viii]WHO Air quality guidelinesfor particulate matter, ozone, nitrogendioxide and sulfur dioxide Global update 2005 Summary of risk assessment
[ix]Chowdhury, Sourangsu&Dey, Sagnik.Cause-specific premature death from ambient PM2.5 exposure in India: Estimate adjusted for baseline mortality. Environment International 91 (2016) 283–290
[x]Ambient Air Quality Standard (AAQS) for particulate matter available : https://www.arb.ca.gov/research/aaqs/pm/pm.htm accessed: November 1, 2016
[xi] Evaluation, IARC Monographs – 109
[xii]Residential Air Cleaners (Second Edition) A Summary of available informations. 2009. Indoor Air Quality (IAQ) EPA
[xiii]Indoor air pollution causing more deaths than outdoor.The Statesman.available: http://www.thestatesman.com/news/delhi/-indoor-air-pollution-causing-more-deaths-than-outdoor/104849.html#t5V1XrAtvdQkteZG.99
[xiv]Is your home harming you? New research highlights deadly effects of indoor pollution. University of Surrey.Available : https://www.eurekalert.org/pub_releases/2016-04/uos-iyh041816.php
[xv] Carrington, Damian. 22 February 2016. Indoor and outdoor air pollution claiming at least 40,000 UK lives a year.The Guardian.available : https://www.theguardian.com/environment/2016/feb/22/indoor-and-outdoor-air-pollution-claiming-at-least-40000-uk-lives-a-year
[xvi]Green stoves to replace challahs.Dec 3, 2009.The Times of India.
[xvii] Kumar, Ashok. June 20, 2016. Indoor air in Gurgaon toxic, says survey. available: http://www.thehindu.com/todays-paper/tp-national/tp-newdelhi/indoor-air-in-gurgaon-toxic-says-survey/article8750287.ece
[xviii]http://apps.who.int/gho/data/view.main.1701 retrieved November 1, 2016
[xix]Rees , Nicholas . October 2016. Clear the air for children: The impact of air pollution on children. UNICEF pp. 46
[xx]WHO Air quality guidelines. p. 9
[xxi]Indoor Air Pollution: Indian Perspectives Dr. DamodarBachani, Deputy Commissioner (NCD) , Ministry of Health & FW
[xxii]Ambient Air Pollution Database, WHO, May2016
[xxiii]The 2016 Environmental Performance Index Report p. 19
[xxiv]Rees , Nicholas . October 2016. Clear the air for children: The impact of air pollution on children. UNICEF p. 52
[xxv]Ambient Air Pollution Database, WHO, May2016
[xxvi]The 2016 Environmental Performance Index Report p. 116
[xxvii]The 2016 Environmental Performance Index Report pp. 12-14
[xxviii]Yang, Wang September 28, 2016 South Asia’s pollution spreads to Tibet available: https://www.thethirdpole.net/2016/09/28/south-asias-pollution-spreads-to-tibet/
[xxix]Premkumar, Lakshmi.2016. A Study of the India-Bhutan Energy Cooperation Agreements and the
Implementation of Hydropower Projects in Bhutan.Vasudha Foundation. pp. 20-23
[xxx] Roy, DivyanshuDutta NDTV October 31, 2016 available : https://www.ndtv.com/delhi-news/cloud-of-smog-grips-delhi-north-india-morning-after-diwali-1586785
[xxxi]‘Ambient Air Pollution Database, WHO, May 2016 available: http://www.who.int/phe/health_topics/outdoorair/databases/WHO_AAP_database_May2016_v3web.xlsx?ua=1
[xxxii]The Global Green Economy Index GGEI 2016 5th Edition – September 2016
[xxxiii] CO2 emissions from fuel combustion, IEA, 2016
[xxxiv] 2016 Environment Performance Index (EPI) – Raw data
[xxxv]Ozone Monitoring Instrument Observations of Interannual Increases in SO2 Emissions from Indian Coal-Fired Power Plants during 2005–2012.Environmental Science & Technology. available: http://pubs.acs.org/doi/abs/10.1021/es4039648
[xxxvi]Rees , Nicholas . October 2016. Clear the air for children: The impact of air pollution on children. UNICEF
[xxxvii]Ghosal ,Anirudha & Chatterjee, Pritha. April 2, 2015. Landmark study lies buried: How Delhi’s poisonous air is damaging its children for life. The Indian Express. available: http://indianexpress.com/article/india/india-others/landmark-study-lies-buried-how-delhis-poisonous-air-is-damaging-its-children-for-life/
[xxxviii]OECD POLICY HIGHLIGHTS The economic consequences of outdoor air pollution
[xxxix] Jain, Deepti. September 9th, 2016. Air pollution cost India 8.5% of its GDP in 2013: study. Livemint.available: http://www.livemint.com/Opinion/AU3JZ499V8mJKHbUEZEDmO/Air-pollution-cost-India-85-of-its-GDP-in-2013.html
[xl]OECD POLICY HIGHLIGHTS The economic consequences of outdoor air pollution
[xli]OECD ENVIRONMENTAL OUTLOOK TO 2050: The Consequences of InactionHIGHLIGHTS
[xlii]Goel, Deepti& Gupta, Sonam. The Effect of Metro Rail on Air Pollution in Delhi . WHO
[xliii]GPI is surveyed and published by The Institute for Economics and Peace (IEP) available : http://static.visionofhumanity.org/sites/default/files/GPI%202016%20Report_2.pdf
[xliv]2016 Global Peace Index p. 11
[xlv]https://treaties.un.org/pages/ViewDetails.aspx?src=TREATY&mtdsg_no=XXVII-7-d&chapter=27&clang=_en
[xlvi] India unveils the world’s largest solar power plant. Available: http://www.aljazeera.com/news/2016/11/india-unveils-world-largest-solar-power-plant-161129101022044.html
[xlvii]Supreme Court bans sale of firecrackers in Delhi, NCR
[xlviii]Badarpur thermal power plant to remain shut till Jan 31, 2017
Available : http://indianexpress.com/article/cities/delhi/badarpur-thermal-power-plant-to-remain-shut-till-jan-31-2017-4380987/