What really causes falling productivity growth? The answer seems to be very much energy-related. Human labor by itself does not cause productivity growth. It is human labor, leveraged by various tools, that leads to productivity growth. These tools are made using energy, and they often use energy to operate. A decrease in energy consumption by the business sector can be expected to lead to falling productivity growth. In this post, I will explain why such a pattern can be expected, and show that, in fact, such a pattern is happening in the United States.

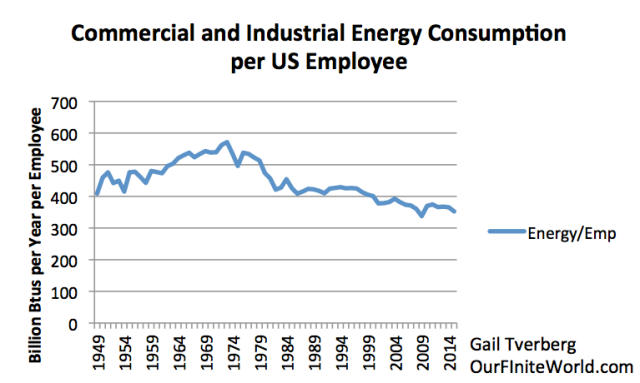
Preview of Figure 4. Total quantity of per capita energy used by the US Commercial and Industrial Sectors (excluding transportation). Computed by dividing EIA Energy Consumption by Sector by Total Non-Farm Employment from the Bureau of Labor Statistics.
Background
The problem of falling productivity growth seems to be a concern to many economists. An August Wall Street Journal article is titled, Productivity Slump Threatens Economy’s Long-Term Growth. The article says, “Productivity is a key ingredient in determining future growth in wages, prices and overall economic output.”
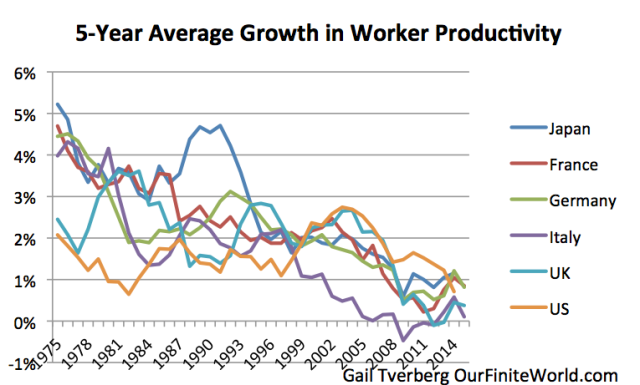
The general trend in falling productivity growth does not seem to be particularly recent. OECD data shows a long-term pattern of slowing productivity growth, dating back to the 1970s for many developed economies.

Figure 1. Five-year average growth in productivity per hour worked based on OECD data.
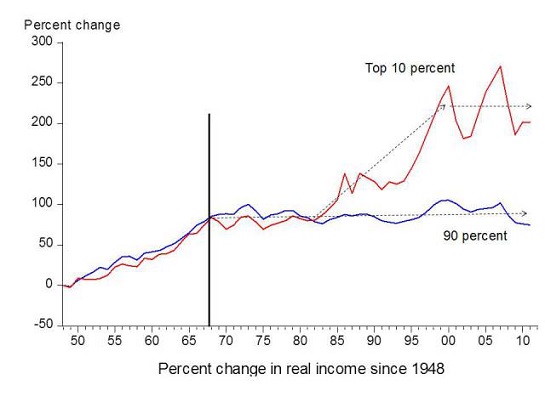
Falling productivity can be expected to affect wages. Figure 2 shows that in the United States, wages for both low and high paid workers increased much faster than inflation between 1948 and 1968. Between 1968 and 1981, wages for both sets of workers stopped rising. After 1981, wages for high paid workers (“Top 10 percent”) have risen much faster than for the bottom 90%. This reflects the way this lower productivity has been distributed to the work force. Low-wage workers have been affected to a much greater extent than high-wage workers.

Figure 2. Chart comparing income gains by the top 10% to income gains by the bottom 90% by economist Emmanuel Saez. Based on an analysis of IRS data, published in Forbes.
A Major Culprit in Falling Productivity Seems to Be Diminishing Returns with Respect to Oil Extraction
Many people believe that the only oil problem we need to worry about is the possibility that supply will “run out” at some point in the future. In my opinion, the real problem is different. What we are experiencing is diminishing marginal returns with respect to oil supply. In other words, it is becoming increasingly expensive to extract and process oil. Total costs, including wages for human labor, the cost of capital, the cost of energy to extract the oil, and required tax payments, are rising ever higher. Businesses are finding it nearly impossible to earn a reasonable profit extracting oil. If oil producers want to cover all of their costs, they need to borrow an increasing amount of money simply to cover normal business expenses, including the development of new fields (to replace currently depleting fields) and the payment of dividends.

Figure 3. Bloomberg exhibit showing that returns for three large oil companies on a “cash” basis fell after 2008, and are now at 50-year lows. CROCI means “Cash Return On Capital Invested.” Bloomberg source.
The problem of diminishing marginal returns extends to other commodity types as well, such as coal, natural gas, fresh water, and metals. Oil is especially important, because it is energy-dense and easy to transport, making it the world’s most-used fossil fuel. At the same time, we are experiencing rising costs for pollution control of various kinds, including attempts to prevent climate change.
The combination of diminishing returns for commodity production together with rising pollution control costs tends to make the world economy increasingly inefficient. This increased inefficiency affects the cost of producing many things that consumers value, including food, fresh water, housing, and transportation. Indirectly, the ability of businesses to create jobs that pay well is affected, also. I believe that this growing inefficiency in producing goods and services is the basis for the falling growth in productivity that appears in Figure 1.
Why Diminishing Returns with Respect to Energy Supplies Are Likely to be the Culprit in Falling Productivity
There are several basic issues that make our economy vulnerable to the impacts of diminishing returns:
- Energy plays a critical role in creating goods and services, and thus in economic growth.
- Energy that is very inexpensive to produce is important in setting up a benevolent cycle of greater productivity and more economic growth.
- Diminishing returns for oil and other energy products lead to higher costs of production. If these higher costs of production are passed through to the consumer as higher prices, this leads to what we think of as a recession, and a slow-down in economic growth.
- The timing of falling productivity “matches up” with falling energy consumption on the part of employers, and also with high oil prices.
Energy plays a critical role in economic growth because energy is necessary for all kinds of economic activity. Energy allows transportation to take place; it allows heating to take place, so metals can be smelted and chemical reactions of many kinds can take place; it allows the use of computers and the internet. When workarounds for problems are needed–for example, increased pollution control, or deeper wells, or desalination plants–all of these workarounds also require the use of energy products. So, the problem is not simply that it takes more fossil fuel energy to create energy products. Many other parts of the economy, including pollution control and extraction of fresh water and minerals, become more demanding of energy supplies as well.
Cheap-to-produce oil and other types of energy are important in setting up a cycle of economic growth. We think of productivity growth as being something that an employee is able to do. In fact, productivity growth is enabled by the use of “tools” that the employer (or the government) gives workers, allowing these workers to create more goods and services per hour worked. These tools can be either physical tools, such as machinery, computers, vehicles, and roads, or they can be tools provided through more specialization and training. In the case of physical tools, it is clear that energy is used both to create and operate the tools. In the case of specialization, energy is needed in a more indirect way; extra energy allows the economy to have sufficient surpluses to permit training of specialized workers, and also to allow them to have higher wages later.
Thus, we can think of human labor as being increasingly leveraged by energy-related tools. In fact, if we divide energy consumption of businesses (commercial and industrial) by the total number of non-farm employees in the United States, we find that energy consumption per employee falls very much according to the pattern we might expect, based on the rise and then fall in productivity growth shown in Figures 1 and 2. A slowdown in energy leveraging seems to correlate with the decline in the rate of productivity growth.

Figure 4. Total quantity of per capita energy used by the US Commercial and Industrial Sectors (excluding transportation). Computed by dividing EIA Energy Consumption by Sector by Total Non-Farm Employment from the Bureau of Labor Statistics.
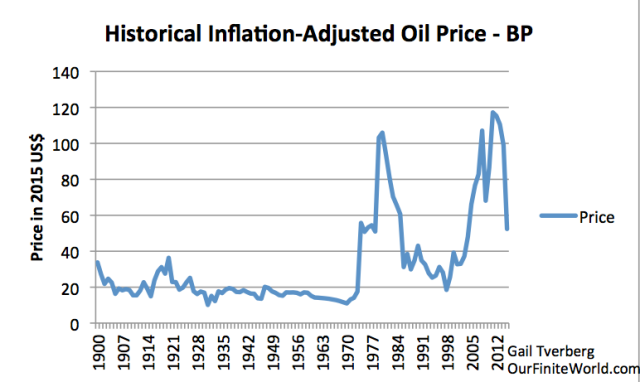
Figure 4 shows that energy consumption per employee reached a peak in 1973. Energy consumption per employee started falling in 1974. This date corresponds to the first major run-up in oil prices (Figure 5). Oil prices, on an inflation-adjusted basis, have never returned to the very low level experienced prior to 1973.

Figure 5. Historical annual average price of oil, for a grade of crude similar to “Brent,” based on data of 2016 BP Statistical Review of World Energy.
The period between the end of World War II and the early 1970s was generally a period in which inflation-adjusted oil prices were under $20 per barrel. At this very low price level, it made sense to add a new interstate highway system and to greatly upgrade the electric grid and the oil pipeline distribution systems. Once oil became high-priced, the US greatly backed away from leveraging worker productivity with such big projects. Other changes began as well, including gradually shifting manufacturing to other countries. These countries typically had lower labor costs and a cheaper energy mix (more coal and hydroelectric, and less oil).
The first run-up in prices occurred after US oil supply reached a peak in 1970 (Figure 5). According to a presentation by Steve Kopits, the second run-up in prices started occurring about 1999 (Figure 6). By then, we reached a point where a disproportionate share of the cheap-to-extract oil had already been removed. Oil producers needed to start work on new oil fields in areas where extraction costs were higher.

Figure 6. Figure by Steve Kopits of Westwood Douglas showing trends in world oil exploration and production costs per barrel. CAGR is “Compound Annual Growth Rate.”
Oil’s diminishing returns affect the economy. As we reach diminishing returns with respect to oil production, the cost of producing additional barrels of oil tends to increase. If this higher cost is passed on to goods made directly and indirectly with oil products, we find that the prices of many products rise. Food costs are particularly affected, because oil is used extensively in agriculture and in transporting goods to market. Higher oil prices affect the cost of other types of goods, because many goods–even coal–are transported using oil. The higher cost of oil tends to ripple throughout the entire economy.
The problem, however, is that higher oil costs lead to lower productivity, because employers and governments tend to purchase fewer energy products for the benefit of their workers when oil prices are high. We end up with a mismatch:
- The cost of oil products, and many other products, tends to rise.
- The productivity of workers tends to grow more slowly. Wages rise very slowly, if at all. They certainly do not keep up with soaring oil prices.
The result of this mismatch is recession, as occurred in the 2007-2009 period. Economist James Hamilton has shown that 10 out of 11 post-World War II recessions were associated with oil price spikes. A 2004 IEA report states, “. . . a sustained $10 per barrel increase in oil prices from $25 to $35 would result in the OECD as a whole losing 0.4% of GDP in the first and second years of higher prices. Inflation would rise by half a percentage point and unemployment would also increase.”
A Second Way Diminishing Returns Can Work Out Badly: Prices that Are Too Low and Oversupply
In the preceding section, I explained how oil prices, if passed on to the consumer via higher prices of other goods, could lead to recession. Because our economy is a networked system, the situation doesn’t need to work this way to come out badly. There is an alternative scenario in which oil prices stay too low for businesses extracting oil to make an adequate profit. In this scenario, it is businesses, rather than consumers, who find that they have a huge financial problem. This is the problem we are encountering now. In fact, it is not just oil-producers who have a profitability problem; the profitability problem extends to businesses producing coal, natural gas, metals, and many kinds of agricultural commodities.
The reason why this kind of low-price scenario can take place (despite rising costs) is because workers are also consumers. We saw in Figure 2 that the wages of the lower 90% of workers tend to lag behind when energy consumption per worker is falling. There are a very many workers in the bottom 90%. If the wages of these workers lag behind, homes, cars, vacations, and many other kinds of discretionary goods become less affordable. The reduced demand for these finished products leads to lower demand for a wide range of commodities. This lower demand tends to push commodity prices of many kinds lower, even though the cost of production is rising. As a result, profits for a wide range of commodity producers tend to fall in a way similar to that shown in Figure 3.
It may be that we can expect a recessionary impact, a short time after profits fall. According to Deutsche Bank:
Profit margins always peak in advance of recession. Indeed, there has not been one business cycle in the post-WWII era where this has not been the case. The reason margins are a leading indicator is simple: When corporate profitability declines, a pullback in spending and hiring eventually ensues.
The article goes on to show that there is a lag of about two years between the time of profit compression and the time when recession hits. The amount of variability is quite high, with one recession coming as soon as 4 quarters after a fall in profitability, and two coming as late as 15 or 16 quarters after a fall in profits. The median lag was 8 quarters, and the average lag was 9 quarters.
This Deutsche Bank description of the cause of recessions gives an explanation why Hamilton encountered recessions after oil price spikes. These rising oil prices affected one of the costs of production for most companies. These rising costs compressed profits, and eventually led to recession.
This description of the cause of recession shows how recession can also ensue if commodity prices remain too low for an extended period. We know that oil prices began falling in the third quarter of 2014. It is now two years later. Profit margins of many commodity producers have been squeezed. We have already seen layoffs in the oil and coal industries. In this low-priced situation, companies are affected unevenly: some benefit from low prices, while others are hurt by low prices.
Commodities are often essential to economies, especially for countries that export commodities. These exporters are especially likely to be affected by low prices. Impacts are likely to include civil disorder and falling production, similar to what we are now seeing in Venezuela.
Oil importers are dependent on oil exporters, so eventually oil imports must drop. Low oil prices are likely to lead to a drop in locally produced oil products as well. As a result, we can expect that less oil and fewer other energy products will be available for leveraging the labor of human workers. If past patterns hold, we can expect a further decline in productivity growth. Rising oil prices are not really a solution either, because, as we have seen, they tend to lead to recession.
Diminishing Marginal Returns Don’t Just Go Away by Themselves
Economists claim that the law of diminishing marginal returns operates only in the short run, because in the long run, all factors of production are variable. This statement might be true, if we lived in a world without limits. In fact, the amount of arable land is very close to fixed. We have not found a way to stop population growth, either. As a result, the amount of arable land per person is falling. We need to keep finding ways to produce increasing amounts of food per arable acre of land. Doing so typically requires energy products, including oil.
We are having similar problems with fresh water supply. We can solve our falling fresh water per capita problem with deeper wells, long-distance transport, or desalination. Any of these workarounds requires energy products.
Of course, we have had diminishing returns with respect to oil supply since the 1970s. We have not yet found a reasonable workaround. Intermittent electricity is not a reasonable substitute; it does not power existing airplanes, trucks and most cars. When all costs are considered, intermittent electricity tends to be very expensive. Experience shows that if subsidies are given for intermittent electricity, they are needed for other types of electricity generation as well.

Figure 7. Figure by Euan Mearns showing relationship between installed wind + solar capacity and European electricity rates. Source Energy Matters.
The belief that diminishing marginal returns are temporary is probably related to the belief that there are substitutes for everything, including energy supplies. Unfortunately, this is not the case; the laws of thermodynamics dictate otherwise.
As a result, when businesses use falling amounts of energy per capita, we should not be surprised if productivity lags, and if wages for many workers barely rise with inflation. It is possible to get some productivity gains through education, but it is very unlikely that these gains are as large as when more capital goods are used, as well as more direct use of energy. There are also clearly diminishing returns with respect to education and training; for example, if we need 10,000 additional dentists per year, training 50,000 additional dentists per year would not be helpful.
Can We Solve Our Productivity Problem with Lower Interest Rates, or with Increased Deficit Spending?
I wouldn’t count on it. Our problem is an energy problem.
Increased deficit spending could perhaps raise commodity prices a bit, and thus help the profitability of companies producing commodities. The reason commodity prices might rise is because increased spending by governments would act to supplement the low spending by workers who are suffering from low growth in wages. The sale of goods might rise for a while, but productivity of workers would still lag. Economic growth would, at best, remain very slow. If the economy were headed for recession or the collapse of commodity exporters, that situation would continue to be the case.
Lower interest rates would likely be even less helpful than deficit spending. There is no guarantee that these low interest rates would lead to increased spending on capital goods that would benefit workers. Banks in Europe and Japan would likely have even more problem with adequate profitability than they do now. Bank failure would become even more of a concern than it is now.
Our problem is really a lack of very cheap-to-produce energy that can be used to inexpensively leverage the labor of human workers. This energy needs to be of the correct kind to match the requirements of existing equipment. Without this leveraging, it is likely to be impossible to fix our productivity problem.
Gail E. Tverberg graduated from St. Olaf College in Northfield, Minnesota in 1968 with a B.S. in Mathematics. She received a M.S. in Mathematics from the University of Illinois, Chicago in 1970. Ms. Tverberg is a Fellow of the Casualty Actuarial Society and a Member of the American Academy of Actuaries. Ms. Tverberg began writing articles on finite world issues in early 2006. Since March 1, 2007, Ms. Tverberg has been working for Tverberg Actuarial Services on finite world issues. Her blog is http://ourfiniteworld.com


